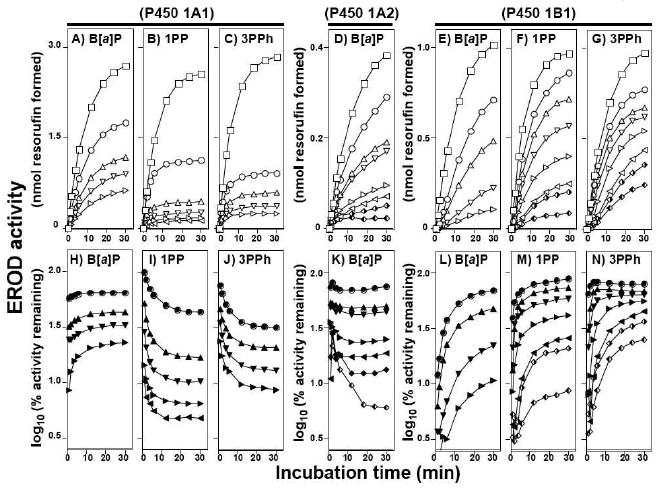
Figure 3.

Inhibition of P450 1A1- (parts A, B, C, H, I, and J), P450 1A2- (parts D and K), and P450 1B1- (parts E, F, G, L, M, and N) dependent EROD activity by B[a]P (parts A, D, E, H, K, and L), 1PP (parts B, F, I, and M), and 3PPh (parts C, G, J, and N). Experiments were done at 37°C. In parts A through G, formation of resorufin was plotted with increasing incubation time and the squares (□)) in the figures indicate activity without inhibitors. In parts H to N, EROD activities were presented as log10 (% activity remaining). Concentrations of B[a]P used were 42, 83, 166, and 333 nM for both P450 1A1 (parts A and H) and 1B1 (parts E and L) and 5.2, 10, 21, 42, 83, 166, and 333 nM for P450 1A2 (parts D and K). Concentrations of 1PP were 8.3, 33, 88, 444, and 1300 nM for P450 1A1 (parts B and I), and 17, 25, 33, 66, 133, and 266 nM for P450 1B1 (parts F and M). Concentrations of 3PPh were 170, 330, 670, and 1300 nM for P450 1A1 (parts C and J), and 16, 33, 66, 130, 270, 333, and 500 nM for P450 1B1 (parts G and N). All of the traces in the figures are indicated from top to bottom, with increasing concentrations of inhibitors.
