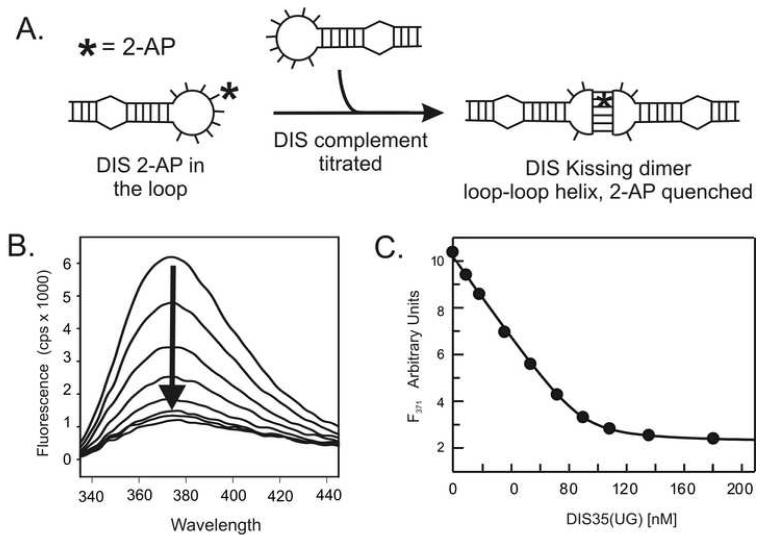
Fig. 3.
(A) Incorporation of a 2-AP, indicated schematically by an asterisk in the loop sequence of the DIS, allows the ‘kissing’ interaction to be quantified as a function of quenching of the fluorescence of the 2-AP base as it forms a stacked, base pair in the ‘kissing’ dimer loop-loop helix. (B) An example of the observed fluorescence changes accompanying titration of 100 nM DIS24(GA)-12ap with increasing concentrations of DIS23(HxUC) in standard buffer with 5 mM MgCl2 at 25 °C. Emission spectra are plotted from 330 to 450 nm. (C) Representative fitted plot of the fluorescence decrease at 371 nm as a function of total DIS35(UC) concentration for a titration using 100 nM DIS35(AG)-19ap. The solid curve is fit (KD = 2.2 ± 0.5 nM) using a single site equilibrium binding equation (1).

