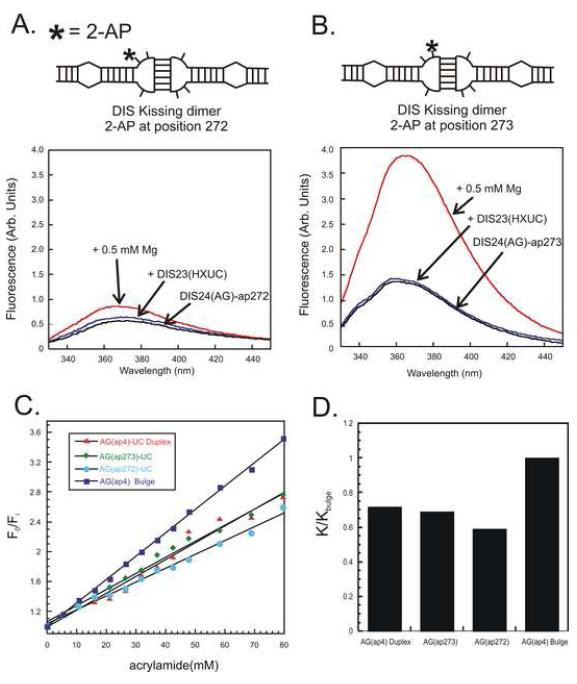
Fig. 5.
Observed changes in the fluorescence spectral intensity of the DIS stem-loop with a 2-AP label at position 1 (A) or position 2 (B) in the loop in response to addition of 1:1 stoichiometric amount of the DIS complement and then the addition of 0.5 mM MgCl2. Emission spectra are plotted from 330 to 450 nm. (C) An example of an acrylamide quenching titration assay aimed at determining the accessibility of the unpaired purines in the loop of the DIS ‘kissing’ RNA complex. The relative fluorescence with respect to increasing acrylamide concentration for a DIS ‘kissing’ RNA dimers with 2-AP at position 1 (blue circles) and position 2 (green diamonds) of the loop are plotted with similar titrations shown for two control structures, one in which the 2-AP is in a bulged position (blue squares) and a second (red triangles) where 2-AP is base paired within a helix. (D) Slopes of the Stern–Volmer plots for each 2-AP labeled RNA relative to that of the (AG)-4ap bulged position. The relative sensitivity to the quench (K/Kbulge) of the 2-AP position within the DIS dimer is defined as the slope for the indicated 2-AP position (K) divided by the slope measured for the (AG)-4ap bulged position (Kbulge).

