
Figure 1.
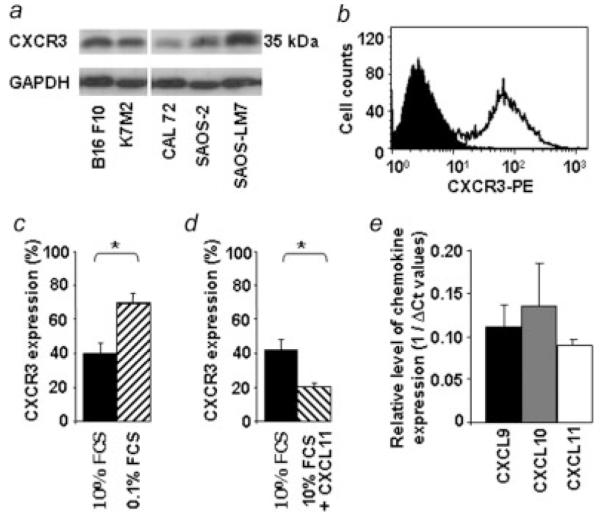
Expression of CXCR3 on mouse and human osteosarcoma cell lines. (a) Western blot analysis of CXCR3 expression in mouse K7M2 and human CAL 72, SAOS-2, SAOS-LM7 osteosarcoma cells. Human B16F10 melanoma was used as a positive control of CXCR3 whereas glyceraldehyde-3-phosphate dehydrogenase (GAPDH) was used for control of equal loading. (b–d) Flow cytometry detection of CXCR3. K7M2 cells were stained for surface CXCR3 and analyzed by flow cytometry. (b) Filled histogram represents cells stained with the isotype-matched control antibody. Open histogram shows cells stained with an anti-CXCR3 antibody. (c–d) Data reported as the percentage of total staining positive for CXCR3: (c) K7M2 cells were cultured for 48 hr in medium containing 0.1% FCS (black bar) or 10% FCS (hatched bar). (d) K7M2 cells grown in 10% FCS were either not exposed (black bar) or exposed for 1 hr (hatched bar) to 500 ng/mL murine CXCL11. (Student’s t test; (p < 0.05). (e) Expression of CXCR3 ligands in mouse healthy lungs. Relative levels of expression are determined by quantitative RT-PCR analysis using GAPDH as normalizing gene. (n = 3 mice).