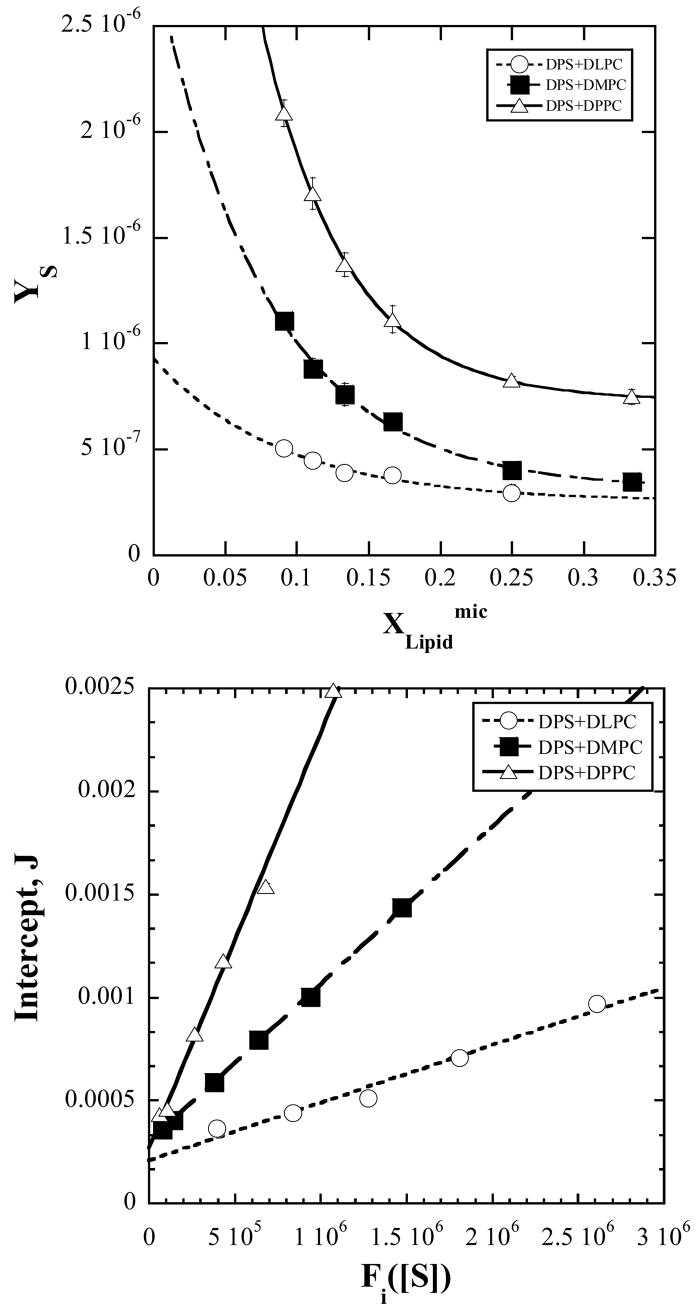
Figure 5.
(a) Observed micelle composition dependence of the modified slope, YS, and fits to the exponential variation predicted by the model in eq. 22. The fits yield g1, and for each of the investigated lipids.
(b). Data points are the observed intercepts J vs, the composition dependent function Fi ([S]) (defined by eq. 23). The line is that predicted by eq. 23 calculated with the values obtained in part (a) for the fit parameters g1 and .

