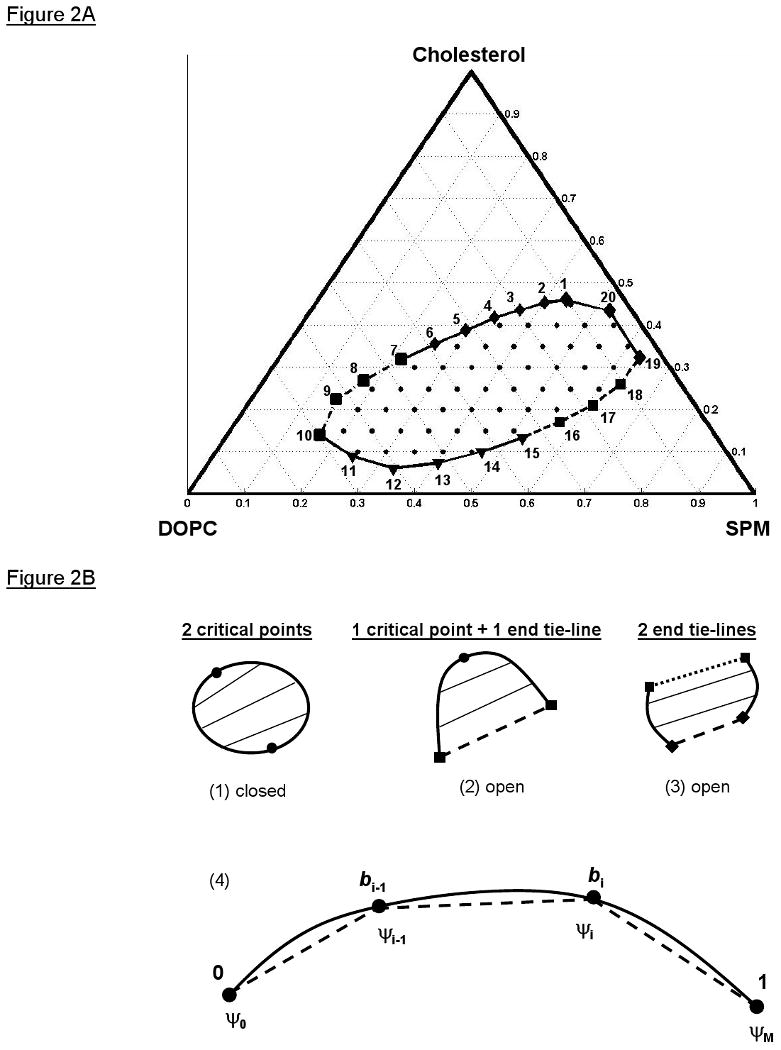
Figure 2.

Coexistence curve configurations for two-phase coexistence regions and the chord-length parameterization of curves. A) The coexistence curve of the Lo + Ld phase coexistence region of SPM/DOPC/Chol plotted on the Gibbs' triangle (2, 3). The short dotted-dashed section at the far left of the coexistence curve indicates roughly where there is a critical point; the dashed section to the lower right indicates a region of estimated transition between the Lo + Ld two-phase region and the three-phase region (2, 3). The horizontal dotted lines represent constant cholesterol mole fractions, the 60° dotted lines represent constant SPM mole fractions, and the 120° dotted lines represent constant DOPC mole fractions. The data that is fit in the TLF method consists of compositions on the coexistence curve (20 samples connected by solid black line) and compositions within the coexistence region (51 samples, dots). Based on analysis of the 16PC ESR spectra on the coexistence curve (Figure 6A) and the outer hyperfine splittings of these spectra (Figure 6B), the coexistence curve compositions are divided into 8 Lo compositions (diamonds), 5 Ld compositions (triangles), and the 2 phase transition regions (squares). B) The coexistence curve configurations for a two-phase coexistence region showing (1) a closed configuration with two critical points, (2) an open configuration with one critical point and one end tie-line (dashed line) to a neighboring three-phase triangle, or (3) another open configuration with two end tie-lines (dashed and dotted lines) to two different three-phase triangles. (4) The chord-length parameterization of curves is an approximate arc-length parameterization. The chord-length parameters b lie on the interval [0,1]. The solid line is the real curve and the entire dashed line is its polygonal representation with M total points. The chord-length parameters are calculated from the Euclidean lengths of the individual dashed intervals (i.e. chords of the curve).
