
Figure 6.
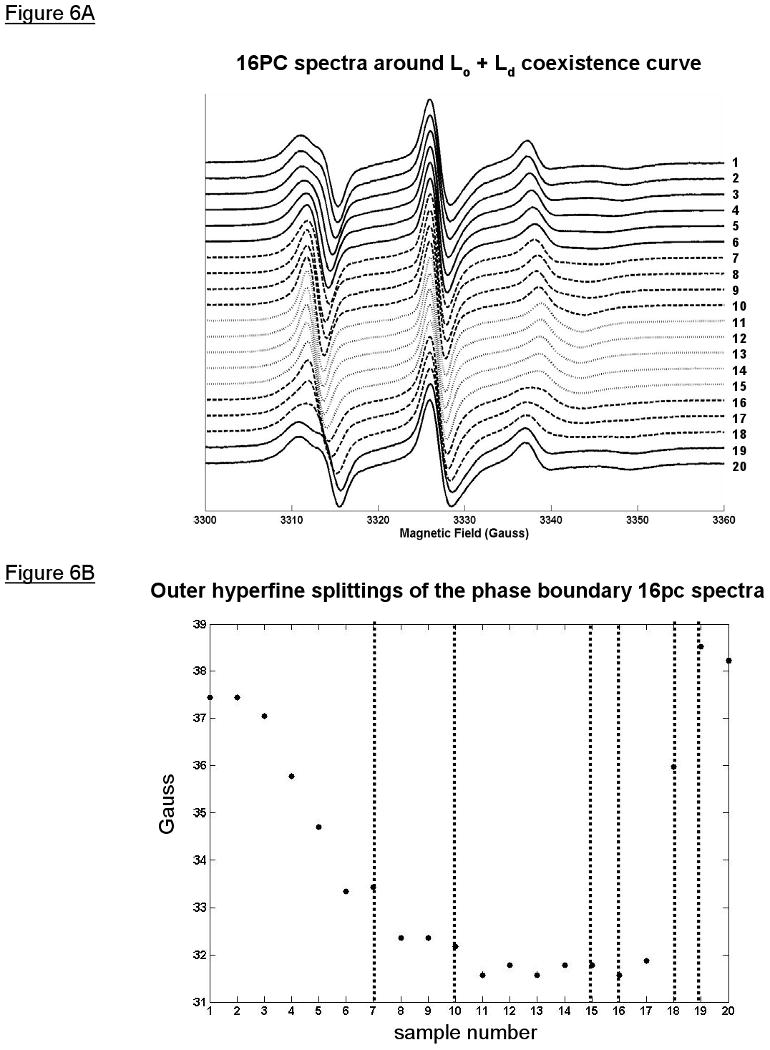
ESR spectra obtained from compositions along the coexistence curve reveal the expected compositional range for a critical point (CPR) and end tie-line (ETR) for the open coexistence curve configuration of the Lo + Ld coexistence region of SPM/DOPC/Chol. A) Stack plot of the 16PC ESR spectra on the coexistence curve showing the Lo spectra (solid lines), Ld spectra (dotted lines), and the CPR and ETR spectra (dashed lines). The low-field and high-field regions flanking the central peak in spectra 16, 17, and 18 show visually the appearance of gel-phase spectral components. B) Plot of the outer hyperfine splitting with sample number along the coexistence curve showing the CPR and ETR (between the dotted lines) having different profiles.