
Figure 5.
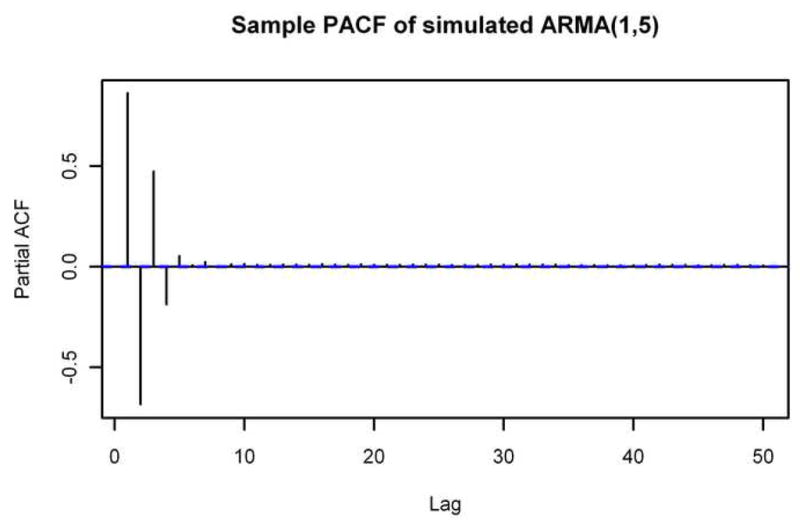

Sample PACFs of Simulated Spectra. The sample partial autocorrelation functions through lag 50 of spectra simulated using the ARMA(1,5) model (top) and an MA(6) model (bottom). Compare to the bottom part of Figure 2.
Official websites use .gov
A
.gov website belongs to an official
government organization in the United States.
Secure .gov websites use HTTPS
A lock (
) or https:// means you've safely
connected to the .gov website. Share sensitive
information only on official, secure websites.
Sample PACFs of Simulated Spectra. The sample partial autocorrelation functions through lag 50 of spectra simulated using the ARMA(1,5) model (top) and an MA(6) model (bottom). Compare to the bottom part of Figure 2.