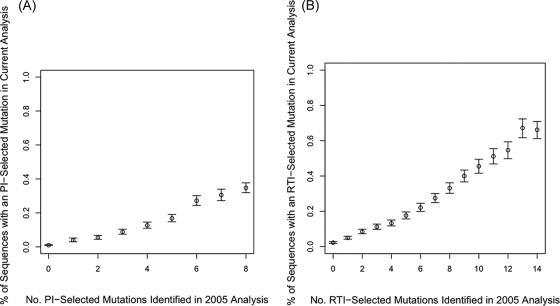
FIG. 1.
Correlation between the number of previously identified treatment-selected mutations (26) and the likelihood of having a new treatment-selected mutation. (A) PI-selected mutations. (B) RTI-selected mutations. Vertical bars are 95% confidence intervals.

