FIG. 4.
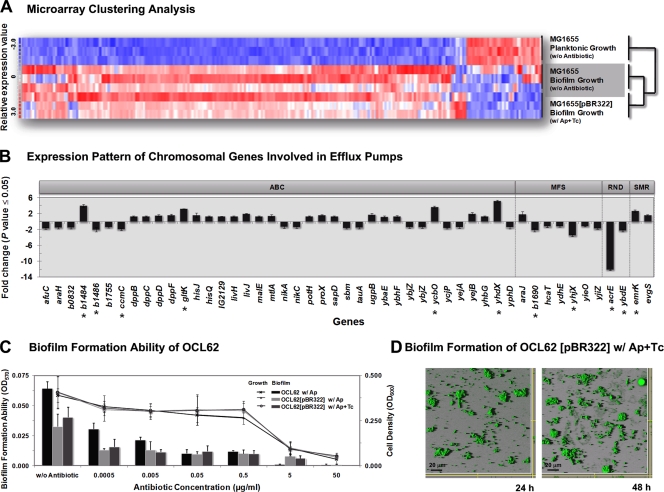
The interplay between the marker genes on the plasmid-induced chromosomal SMR efflux pumps during biofilm development and maturation. (A) Dynamic hierarchical clustering analysis of E. coli gene expression during biofilm formation. Each column represents one gene. Red, upregulated; white, no change; blue, downregulated. The sample profiles were grouped into two clusters: MG1655 planktonic growth versus MG1655 (plasmid free) and MG1655(pBR322) biofilms. For each experiment, three biological replicates were analyzed. (B) Pattern of 49 regulated genes, which encode chromosomal antibiotic efflux pumps, during the biofilm formation of MG1655(pBR322) in the presence of antibiotics but not in MG1655 in neither suspended cultures nor biofilms. Eleven significantly regulated genes (change of ≥2-fold) are labeled with an asterisk. The classification of efflux systems in this study was based on the gene information reported in Affymetrix's NetAffx database. (C) Quantification of the total bacterial growth activity (line graph) and biofilm formation (bar graph) by the modified OCL62 strain, in which emrY, emrK, evgA, and evgS were removed and counteracted with TetA(C), with or without pBR322 plasmid, in the absence or in the presence of antibiotics. Results are averages of eight replicates ± standard deviations and are representative of four independent experiments. (D) CSLM photographs of the modified OCL62(pBR322) biofilms in the presence of antibiotic mixture at 24 h and 48 h, respectively. The experiment was duplicated and representative images are shown.

