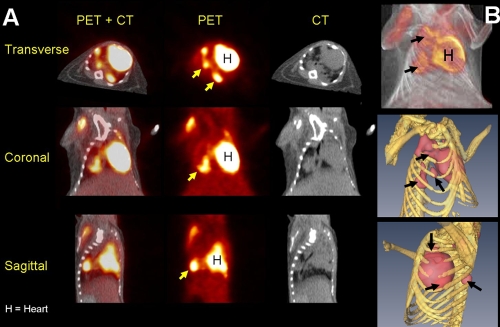
FIG. 3.
[18F]FDG localizes to granulomas in C3HeB/FeJ mice. (A) Transverse, coronal, and sagittal sections (CT, PET, and fused PET+CT) from a Mycobacterium tuberculosis H37Rv-infected C3HeB/FeJ mouse 6 weeks after a low-dose aerosol infection. [18F]FDG-PET activity localized to TB granulomas (arrows). Mean lung [18F]FDG-PET activity in infected animals was significantly higher than that in the uninfected controls at 4, 6, and 8 weeks after infection (P < 0.031). (B) Three-dimensional tomography of the fused PET+CT (top) and isosurface representation of coregistered PET and CT images (bottom). The TB lesions are shown in pink (PET), while the bony rib cage is shown in yellow (CT). As expected, the heart (H) takes up FDG and is visible in all sections.

