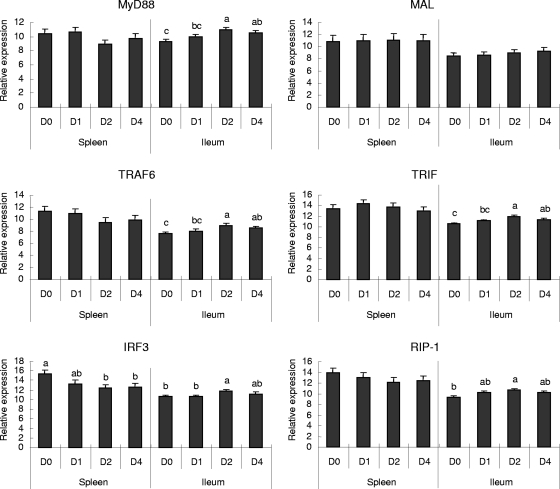
FIG. 2.
Changes (n-fold) in the expression of adaptor molecules involved in the TLR signaling pathway in the spleen and ileal tissues of C. perfringens-challenged chickens as determined by QRT-PCR assays. Relative expression of adaptors from the TLR signaling pathway in the spleens and ilea of chickens was measured by QRT-PCR. Relative expression data were log2 transformed to acquire normal distribution after normalization with respect to β-actin expression and a constant concentration of a plasmid calibrator by using GLM statistical analysis of values for the same tissue type (splenic or ileal) (n = 8). Data are presented as changes (n-fold) calculated by comparing expression levels on D1, D2, and D4 p.i. with those on D0. A value of >1 represents upregulation; a value of <−1 represents downregulation. The bars denoted with different letters represent significant differences before and after challenge (P < 0.05).

