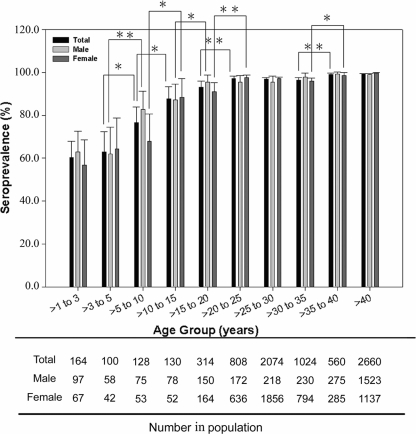
FIG. 1.
HCMV seroprevalence by age group in Shanghai, China. T bars represent 95% CI. Black columns represent HCMV seroprevalence for an entire population. Light gray columns apply to males, and dark gray columns to females. Asterisks represent the statistical difference between group comparisons. One asterisk indicates significant difference (P ≤ 0.05 and P > 0.01), while two asterisks indicate extraordinary difference (P ≤ 0.01). Data below indicate the population number in each corresponding age group.

