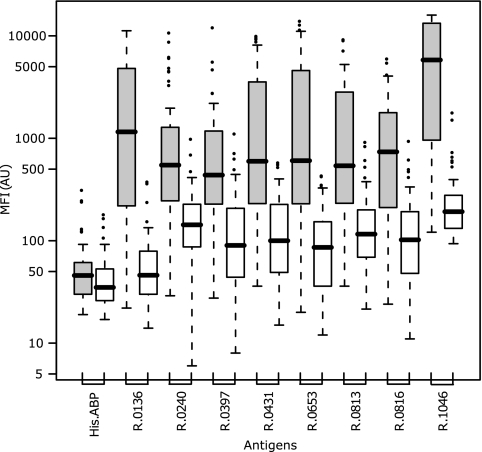
FIG. 4.
Discriminatory power of selected proteins. The range of signal intensities from the screening of all 52 CBPP-positive sera (gray bars) and 24 CBPP-negative sera (white bars; Swedish control sera were excluded) against the eight selected antigens shows a large discrepancy between the two groups. Potential binding to the fusion tag was monitored by the His6ABP bead. The box plot was built directly on signal intensities, and the box contains 50% of the data points (interquartile range), the black line denotes the median signal, and the whiskers extend to the furthest data points unless they are situated further away than 1.5 times the interquartile range. Outliers are presented as circles.

