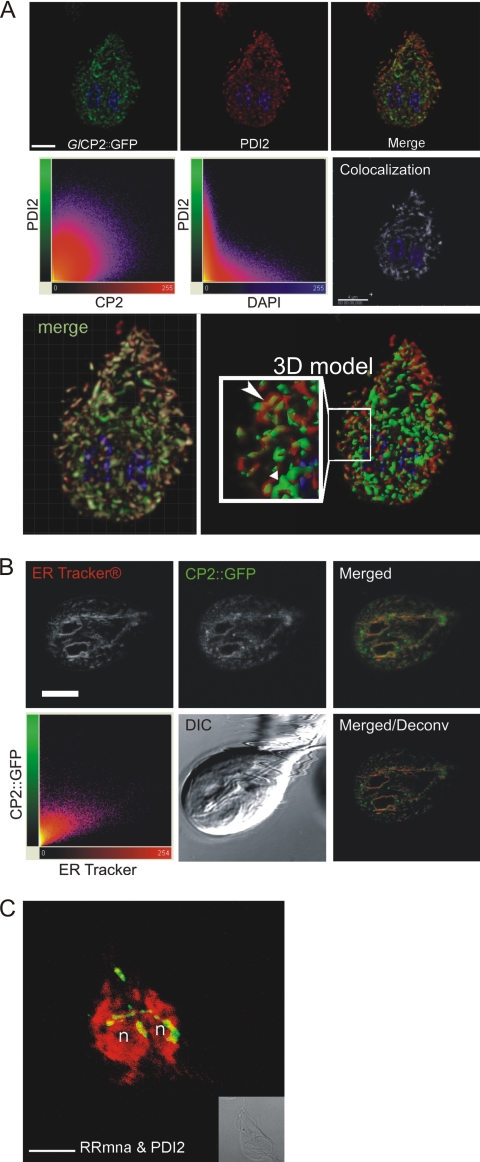
FIG. 5.
GlCP2::GFP and GlCP protease activity colocalized with, or was immediately adjacent to, the ER marker PDI2 in the perinuclear region and the TVN. (A) (Top row) Deconvoluted single optical sections from confocal microscopy of trophozoites show that cathepsin B-like cysteine protease GlCP2::GFP (green) colocalized with PDI2 (red), extending throughout the TVN. The tubulovesicular nature of the TVN is apparent. Nuclear DNA was stained with DAPI. Scale bar, 3 μm. (Middle row) Software analysis enabled visualization of PDI2 and GlCP2::GFP colocalization. Scatter plots of the two labels show significant colocalization of CP2 and PDI2 in ER structures (left). Control: ER-localized PDI2 and DAPI-stained nuclear DNA show minimal colocalization (middle). (Right) Colocalized pixels in a separate channel colored white, with nuclear DNA in blue. Scale bar, 4 μm. (Bottom row, left) Volumetric reconstruction of confocal sections with a superimposed colocalization channel in white. (Right) Isosurface-rendered 3D model of PDI2 and GlCP2::GFP distribution. The inset shows membrane-bound PDI2 (red) and luminal CP2 (green) in the TVN (elongated arrowhead), in some instances occupying distinct subdomains (short arrowhead). GlCP2::GFP-labeled compartments lacking PDI2 staining may represent subcompartments of the ER. (B) Colocalization of ER Tracker and GlCP2::GFP in living adherent trophozoites. (Top row) Single optical sections showing the distribution of the two markers and a merged color image. (Bottom row, left) Scatter plot of the two labels. (Middle) DIC image; note the wave pattern of the ventral flagella as a hallmark of cell viability. (Right) Merged image after deconvolution (Deconv). Scale bar, 3 μm. (C) 3D projection of cysteine protease activity against the substrate Z-RR-MNA (green) colocalized with, or immediately adjacent to, PDI2 (red) in the perinuclear region and in portions of the TVN. The projection highlights the continuity of the TVN. Protease activity (green) is less prevalent than in Fig. 3C due to loss of fluorescent protease activity product during PDI2 immunolocalization washes. n, nucleus. Scale bar, 5 μm.

