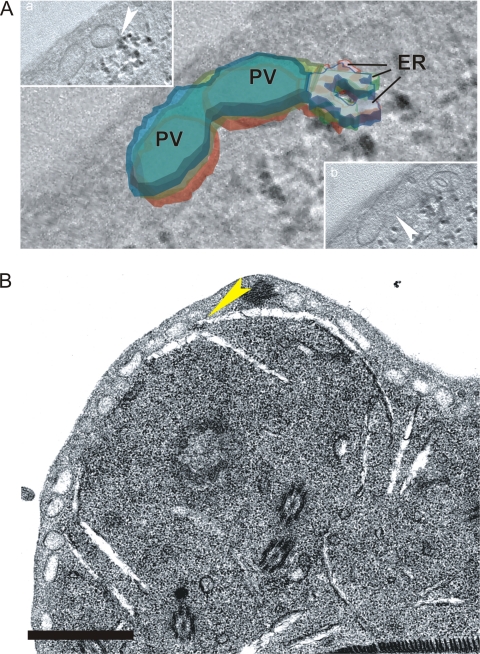
FIG. 8.
Identification of sites of fusion between the TVN and PVs. (A) In a stack of three consecutive EM tomography images, fusion between a large PV and the branching ER-like TVN (identified by the G6P reaction product [black]) was observed (inset a, arrowhead, inferior z-stack slice). Fusion between two adjacent PVs is also seen (inset b, arrowhead, superior z-stack slice). Each subsequent section is represented by a different color (red, green, and blue). The TVN is outlined with color, while PVs are filled. (B) Fusions between tubular extensions (slit-like spaces) of the TVN and PVs at the periphery of the cell were seen on EM sections (yellow arrowhead). Scale bar, 1 μm.

