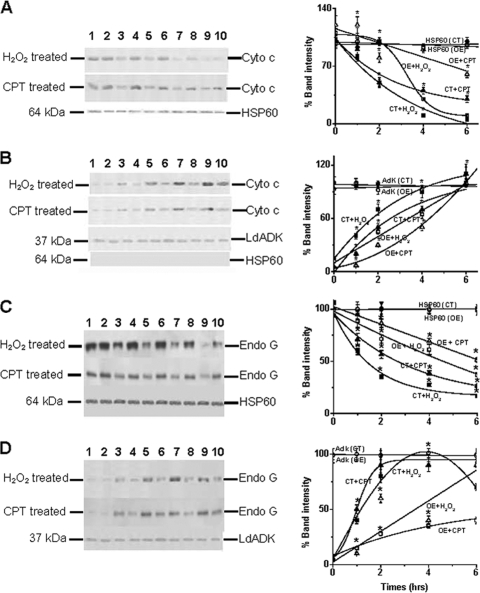
FIG. 4.
Western blot analysis for cytosolic cytochrome c and endonuclease G release from mitochondria isolated from control cells (CT) and LmAPX-overexpressing cells (OE). The concentrations of H2O2 and CPT used were 1 mM and 5 μM, respectively. Lanes 1 and 2, untreated control and LmAPX-overexpressing cells, respectively; lanes 3, 5, 7, and 9 control cells with 1 h, 2 h, 4 h, and 6 h of treatment, respectively; lanes 4, 6, 8, and 10, LmAPX-overexpressing cells with 1 h, 2 h, 4 h, and 6 h of treatment, respectively. Panels A, B, C, and D represent immunoblot and densitometric analysis of cytochrome c in the mitochondrial fraction, cytochrome c in the cytosolic fraction, endonuclease G in the mitochondrial fraction, and endonuclease G in the cytosolic fraction, respectively. Band intensity is presented as the percentage of cytochrome c or endonuclease G released from untreated cells. Fifty micrograms of total protein was analyzed by 13% sodium dodecyl sulfate-polyacrylamide gel electrophoresis with antibodies specific for T. brucei cytochrome c, L. donovani endonuclease G, HSP 60 (mitochondrial matrix protein), and L. donovani adenosine kinase (cytosolic protein). No HSP 60 was detected in the cytosolic fraction. All the data are representative of at least three independent experiments. *, statistically significant P value of less than 0.05 (P value is less than 0.027).

