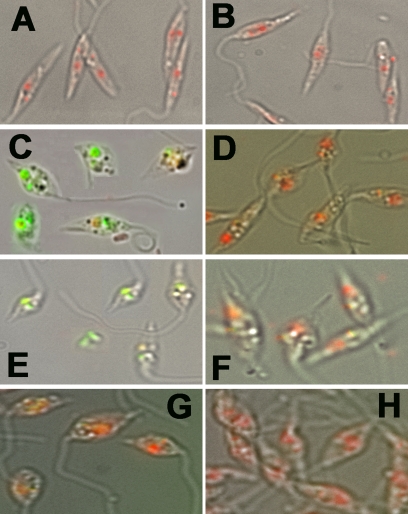
FIG. 6.
TUNEL staining to determine the level of in situ oxidative stress-induced DNA fragmentation. TUNEL-staining cells were counterstained with PI in the presence of RNase. (A) Merged image of control cells under bright-field microscopy. (B) Merged image of LmAPX-overexpressing cells under bright-field microscopy. (C) Control cells with H2O2 treatment for 6 h. (D) Overexpressing cells with H2O2 treatment for 6 h. (E) Control cells with CPT treatment for 6 h. (F) Overexpressing cells with CPT treatment for 6 h. (G) Control cells with H2O2 treatment for 6 h in the presence of a caspase inhibitor (VAD-fmk). (H) Overexpressing cells with H2O2 treatment for 6 h in the presence of a caspase inhibitor (VAD-fmk). All results are representative of three independent experiments.

