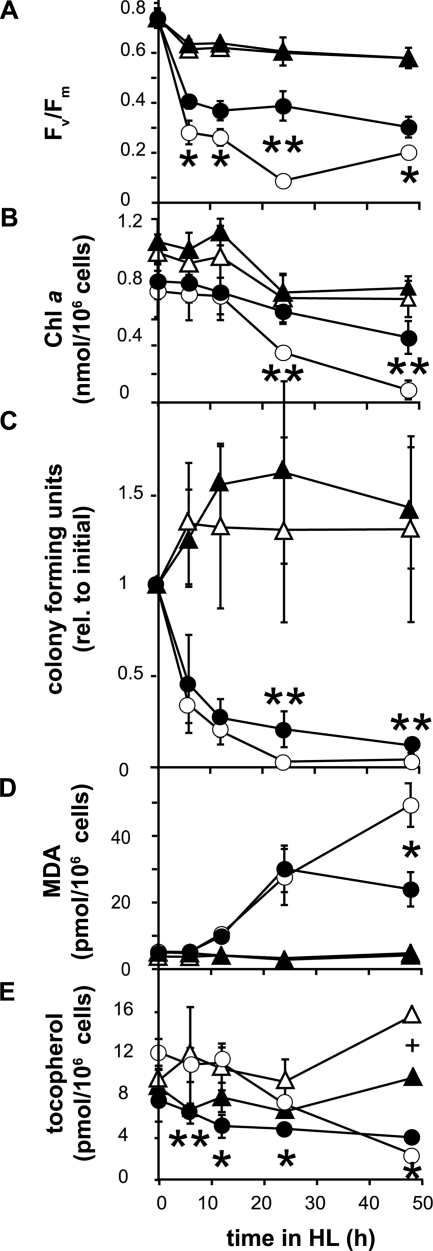
FIG. 5.
Chlorophyll fluorescence, chlorophyll a content, cell viability, lipid peroxidation, and tocopherol content upon high-light (HL) exposure of C. reinhardtii strains. (A) The chlorophyll fluorescence parameter Fv/Fm, representing the maximal photosynthetic efficiency of photosystem II in the dark-adapted state. (B) Chlorophyll (Chl) a content per cell. (C) Cell viability expressed as CFU/ml of culture relative to the initial value (rel. to initial). (D) Lipid peroxidation quantified as malondialdehyde (MDA) equivalents per cell. (E) Tocopherol content per cell. Data shown are means ± standard deviations (n = 4 to 7). Error bars are shown where they are larger than symbols. The differences between the npq1 lor1 and vte3 npq1 lor1 strains were statistically significant (Student's t test) (* indicates a P value of <0.05, and ** indicates a P value of <0.01). The difference in tocopherol contents between the wild-type and vte3 strains at 48 h was statistically significant (Student's t test) (+ indicates a P value of <0.05). Open circles, npq1 lor1 mutant; filled circles, vte3 npq1 lor1 mutant; open triangles, wild type; filled triangles, vte3 mutant.

