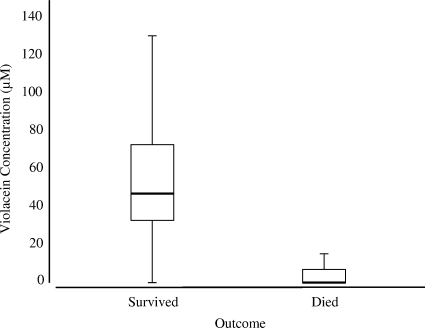
FIG. 3.
Violacein concentrations on salamanders that died (n = 10) and survived (n = 21). Salamanders that died had significantly lower violacein concentrations on their skins (Z = −3.908 and P < 0.0001, Wilcoxon two-sample test). The interquartile range is indicated by the box, the median is indicated by the horizontal line in the box and the bars indicate the highest and lowest values in 1.5 interquartile ranges.

