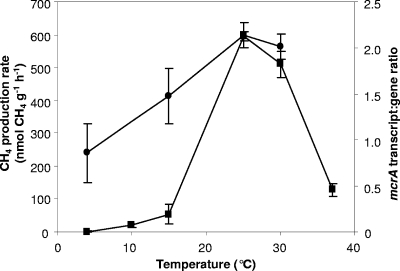
FIG. 1.
Mean peat slurry CH4 production rates and corresponding mean mcrA transcript/gene ratios during incubation of slurries for 6 days at different temperatures. ▪, methane production rate (μmol CH4 g−1 [dry weight] h−1); •, mcrA transcript/gene ratios, calculated from copy numbers ng−1 nucleic acid. Error bars represent the standard deviation from the mean for four replicates.

