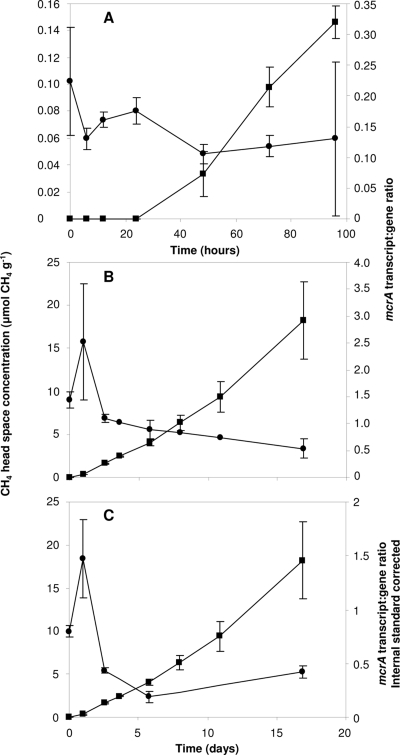
FIG. 2.
Mean mcrA transcript/gene ratios and corresponding CH4 slurry headspace concentrations during time course incubations at 25°C. Results are shown for slurries constructed from peat stored for 6 months (A) or 4 months (B, C). (A, B) mcrA transcript/gene ratios obtained from copy numbers ng−1 nucleic acid. (C) Ratios calculated from E. coli K-12 DNA and mRNA internal-standard-recovery-corrected mcrA abundances. ▪, methane production rate (μmol CH4 g−1 [dry weight]); •, mcrA transcript/gene ratio. The high SE at the last time point in the time course experiment with peat stored for 6 months was caused by a single mcrA transcript abundance 1 order of magnitude higher than other values. The error bars represent the standard deviation from the mean for three replicates.

