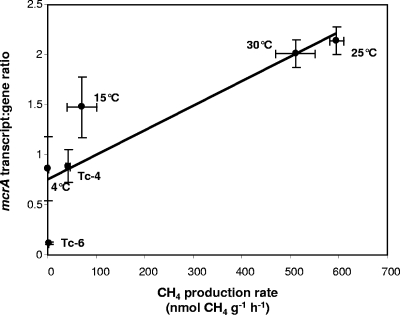
FIG. 4.
Mean slurry CH4 production rates and corresponding mean mcrA transcript/gene ratios. The line shows linear regression (slope = 0.0025; intercept = 0.75; regression coefficient = 0.79). Ratios and rates were compiled from the temperature experiment and both time course experiments. Ratios were calculated from mcrA transcript and gene abundance ng−1 nucleic acid. The error bars represent the standard deviation from the mean for three replicates. Labels denote relevant incubation conditions: Tc-6 represents the time course for slurries constructed from 6-month-old peat; Tc-4 represents the time course for 4-month-old peat; “4°C” represents the 4°C temperature trial, etc.

