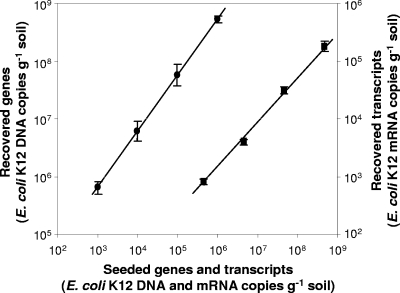
FIG. 5.
Dynamic range of DNA and mRNA recovery after addition of 3.3 × 10⁵ to 3.3 × 10⁸ E. coli K-12 cells to peat before extraction. The slope of linear regression indicates the combined efficiency of extraction and qPCR or RT-qPCR for DNA and mRNA, respectively. The efficiencies were 62 and 93% for DNA and RNA, respectively. ▪, DNA; •, mRNA. Error bars represent the standard deviation from the mean; some error bars are smaller than the symbols.

