Abstract
Based on elementary mode analysis, an Escherichia coli strain was designed for efficient conversion of glycerol to ethanol. By using nine gene knockout mutations, the functional space of the central metabolism of E. coli was reduced from over 15,000 possible pathways to a total of 28 glycerol-utilizing pathways that support cell function. Among these pathways are eight aerobic and eight anaerobic pathways that do not support cell growth but convert glycerol into ethanol with a theoretical yield of 0.50 g ethanol/g glycerol. The remaining 12 pathways aerobically coproduce biomass and ethanol from glycerol. The optimal ethanol production depends on the oxygen availability that regulates the two competing pathways for biomass and ethanol production. The coupling between cell growth and ethanol production enabled metabolic evolution of the designed strain through serial dilution that resulted in strains with improved ethanol yields and productivities. In defined medium, the evolved strain can convert 40 g/liter of glycerol to ethanol in 48 h with 90% of the theoretical ethanol yield. The performance of the designed strain is predicted by the property space of remaining elementary modes.
With the recent rising prices of fossil fuels, development of alternative renewable fuels, such as biodiesel, has become attractive. However, the increase in biodiesel production generates a surplus of crude glycerol since this compound is an inevitable waste by-product resulting directly from the transesterification of vegetable oils or animal fats. For every 3 mol of biodiesel produced, 1 mol of glycerol (about 5 to 10% weight equivalent of biodiesel) is generated. To maximize the full economic potential of the biodiesel process, it is important to convert crude glycerol into useful chemicals (9, 25).
Both chemical conversion and biological conversion of crude glycerol into value-added products have been considered. For instance, chemical conversion based on the etherification of glycerol with either alcohols (methanol or ethanol) or alkenes (isobutene or 2-methylpropene) can produce useful fuels or solvents, or steam reforming of glycerol can result in methanol and hydrogen production (7). Biological conversion utilizes species belonging to the Enterobacteriaceae family, such as Klebsiella pneumoniae (11), Citrobacter freundii (5), Clostridium butyricum (4), and Pantoea agglomerans (3), to convert glycerol to 1,3-propanediol by fermentation.
Even though Escherichia coli belongs to the family Enterobacteriaceae, it cannot ferment glycerol due to a lack of the dha regulon encoding glycerol dehydratase (dhaB) and 1,3-propanediol oxidoreductase (dhaT), which constitute the fermentative 1,3-propanediol-producing pathway (18). However, introduction of this pathway from K. pneumoniae into E. coli can facilitate glycerol fermentation (18), presumably because the redox potential is balanced. In fact, it is well documented that a wild-type E. coli strain cannot grow on glycerol anaerobically in defined medium except after addition of specific electron acceptors (18). Such electron acceptors can come from external sources, including nitrate, nitrite, fumarate, dimethyl sulfoxide, or trimethylalamine-N-oxide, or from internal sources through added fermentative pathways, such as the 1,3-propanediol-producing pathway.
A recent study suggested the feasibility of fermenting glycerol into fuels and other reduced chemicals by inducing the dormant, native 1,2-propanediol fermentative pathway in E. coli without using external electron acceptors (10, 14). This approach, however, faces several critical challenges, such as low specific growth rates resulting in low chemical productivities and coproduction of unavoidable by-products, such as 1,2-propanediol. The reported specific growth rate appears to limit any practical application since a minimal doubling time of about 17 h results in consumption of only 8 to 10 g/liter glycerol after 110 h (10, 14). In addition, glycerol fermentation apparently worked only when complex components, such as yeast extract, tryptone, or amino acids that are required for biomass synthesis, were added to the medium (10, 14).
Here, we took a different approach by employing oxygen as the electron acceptor in well-defined microaerobic growth conditions. We used elementary mode (EM) analysis to rationally design an E. coli cell with minimized metabolic functionality tailored to efficiently convert glycerol to ethanol under these microaerobic growth conditions. EM analysis is a metabolic pathway analysis tool that identifies all pathway options in a metabolic network (16). Knowledge of these pathway options allows rational implementation of only the efficient pathways of interest by removing the inefficient pathways, resulting in a cell with minimal but specialized functionality (20-22, 24). Furthermore, the cell developed is engineered to tightly couple cell growth and ethanol production. This unique characteristic facilitates metabolic evolution of the minimal cell to improve ethanol productivity because faster-growing cells also produce ethanol at a higher rate. We demonstrate here that the performance of the designed strain falls into the range defined by the EMs that are possible.
MATERIALS AND METHODS
Bacterial strains and plasmids.
E. coli MG1655 was used as the wild type. Mutant TCS099 was derived from the wild type and contains nine chromosomal gene knockouts. Its genotype is MG1655 Δzwf Δndh ΔsfcA ΔmaeB ΔldhA ΔfrdA ΔpoxB Δpta Δmdh::kan. TCS099 was constructed from the previously developed strain TCS083 (21) with additional introduction of the knockout mdh gene encoding malate dehydrogenase. mdh knockout was carried out by P1 generalized transduction as previously described (21, 22). TCS083 was infected with P1 lysate prepared from donor strain BW25113 mdh::kan+ (2). After the transductant was isolated with the kanamycin selection marker, its kanamycin gene was removed by using the temperature-sensitive helper plasmid pFT-A (15). The mdh knockout gene was verified by performing a PCR with primers located outside the undeleted portion of the structural gene. The sequences of the primers used are 5′-CTG GAG ACG ATG GAT CAG GT-3′ (forward) and 5′-CAC CAC CTG TTG GAA TGT TG-3′ (reverse). Plasmid pLOI297 (ATCC 68239), which contains pyruvate decarboxylase and alcohol dehydrogenase genes from Zymomonas mobilis, was obtained from the American Type Culture Collection (1).
Growth medium.
All controlled batch bioreactor studies were performed with defined minimal medium containing 3.5 g/liter of KH2PO4, 5.0 g/liter of K2HPO4, 3.5 g/liter of (NH4)2HPO4, 0.25 g/liter of MgSO4·7H2O, 15 mg/liter of CaCl2·2H2O, 0.5 mg/liter of thiamine, 0.12 g/liter of betaine, 1 ml/liter of a stock trace metal solution, 40 g/liter of glycerol (unless otherwise specified), and 10 μg/liter of tetracycline (adapted from media described previously [6, 21, 26]). The stock trace metal solution contained 0.15 g/liter H3BO4, 0.065 g/liter CoSO4, 0.05 g/liter ZnSO4·7H2O, 0.015 g/liter MnCl2·4H2O, 0.015 g/liter NaMo4·2H2O, 0.01 g/liter NiCl2·6H2O, 0.005 g/liter CuSO4·5H2O, and 3 g/liter Fe(NH4) citrate. The first three salt components of the defined minimal medium were autoclaved, while the other components were sterile filtered and added to bioreactors.
Metabolic evolution.
The experiments were conducted aerobically in 250-ml shake flasks with a working volume of 100 ml using the defined minimal medium containing 20 g/liter of glycerol and 10 μg/liter of tetracycline. The metabolic evolution procedure was performed using serial dilution. The metabolic evolution procedure started with a single colony picked from a petri dish freshly spread using a culture stock. The growth conditions were 200 rpm and 37°C. At each serial dilution step, cell cultures with concentrations of 108 to 109 cells/ml in the exponential growth phase were transferred to fresh medium. The initial cell cultures started with concentrations of 105 to 106 cells/ml. To achieve the exact growth conditions for each transfer, fresh medium was placed in the same environment used for the cell cultures at least 2 h before inoculation. Two serial dilutions were performed every day. Serial dilution was stopped when the specific growth rate reached a stable value after 50 culture transfers.
Three independent replicate experiments were performed for metabolic evolution for each strain. At least four data points were collected to measure the specific growth rates. In all cases, the linear regression coefficient resulting from calculating the slope of a plot of the natural logarithm of the optical density at 600 nm (OD600) versus time (in h) was greater than 0.99. For every five transfers, samples of cell cultures were stored at −80°C.
In order to differentiate an evolved strain from its parent and to distinguish variants in different replicate experiments, we used the additional following designation for an evolved strain: “e#rep$,” where “#” is the culture transfer number and “$” is the replicate number. For instance, TCS099/pLOI297 is the parent strain harboring plasmid pLOI297, while TCS099 e50rep1/pLOI297 is the evolved strain derived from TCS099/pLOI297 isolated after 50 rounds of transfer (e50) from replicate 1 (rep1).
Growth in batch bioreactors.
Batch bioreactor experiments were conducted in 10-liter Braun bioreactors (Biostat MD; B. Braun Biotech International, Melsungen, Germany) with a working volume of 6 liters under aerobic conditions. The growth conditions were 37°C and pH 7.0. The pH was controlled using 6 M NaOH and 40% H3PO4. Sterile air was sparged into bioreactors at a flow rate of 500 ml/min. The agitation rate was controlled at a fixed value between 300 and 400 rpm to obtain a specified volumetric transfer coefficient (kLa) for each experiment. Single colonies were picked from freshly streaked plates and grown overnight in 250-ml flasks containing 25 ml of minimal medium. The cultures were then transferred to 500-ml shake flasks containing 200 ml of minimal medium. Exponential cultures grown in shake flasks (37°C, 225 rpm) were then used for inoculation. The same medium was used for inoculation and for the bioreactors. The initial OD600 after inoculation in all batch bioreactors was 0.05.
The percentage of dissolved oxygen (DO) can be monitored by using a DO probe. The concentration of oxygen with 100% saturation in defined medium at 37°C and 1 atm is 6.76 mg/liter.
kLa measurement.
The volumetric transfer coefficient kLa (in /min) was determined by using the non-steady-state method (17). First, a bioreactor filled with medium was sparged with nitrogen to completely remove oxygen. Then air was introduced into the bioreactor, and the increase in the DO level was monitored. The slope of a plot of ln(100% − percentage of DO) versus time (in min) was used to determine kLa.
Analytical techniques.
The cell dry weight was determined based on the following predetermined relationship: 1 OD600 unit = 0.259 g/liter (R2 = 0.942) (21). Metabolite concentrations were determined by using a high-performance liquid chromatography system as previously described (21), with slight modifications in the instrument and the method. Briefly, we used two HPX-87H cation-exchange columns in series (column sizes, 300 by 7.8 mm and 150 by 7.8 mm; Bio-Rad Labs, Hercules, CA) to separate metabolites in the supernatant. Samples were loaded into the columns, which were operated at 50°C. A 5 mM H2SO4 solution was used as the mobile phase and run isocratically at a flow rate of 0.45 ml/min.
Yield calculation and carbon balance.
The ethanol yield on glycerol (YEtOH/glycerol) was determined as previously described (21) by using the following equation: YEtOH/glycerol = (rEtOH/rglycerol)(g ethanol/g glycerol), where rEtOH (in g ethanol/liter/h) and rglycerol (in g glycerol/liter/h) are the ethanol production rate and the glycerol consumption rate, respectively. The percentage of carbon recovered was calculated as previously described (21). The percentage of carbon recovered was close to 100%, as shown in Table S1 in the supplemental material.
E. coli metabolic network.
The metabolic network of E. coli central metabolism used in this work has been described previously (21). In this study, the glycerol degradation pathway was added. This pathway contains two reactions. The first reaction converts glycerol (GLY) to glycerol-3-phosphate (G3P) using glycerol kinase, as follows: 1 GLY + 1 ATP = 1 G3P + 1 ADP. The second reaction converts G3P to dihydroxyacetone phosphate (DHAP) using glycerol-3-phosphate dehydrogenase, as follows: 1 G3P + 1 NAD+ = 1 DHAP + 1 NADH + 1 H+ (13). We calculated all EMs of the E. coli metabolic network using METATOOL 5.0, the currently available, fast, and flexible Matlab-based software package designed to handle complex metabolic networks (23).
Statistical analysis.
Each case study conducted in batch bioreactor experiments was performed at least in duplicate. For each bioreactor run, three samples were collected and analyzed for each time point during the course of cultivation. The parameters, such as titers and yields, are reported below as the mean ± standard deviation of at least six independent measurements from at least two batch bioreactor runs.
RESULTS
Effect of electron acceptors on glycerol fermentation.
E. coli cannot grow anaerobically due to the imbalance of the redox potential (e.g., accumulation of the reducing equivalent NADH). Cell growth can resume in defined medium only if external electron acceptors are provided (18). The external electron acceptors can be in the form of feeding substrates or of pathways that can serve as an electron sink. In order to test the anaerobic conversion of glycerol in silico, we considered four different external electron acceptors (Table 1). The first electron acceptor, fumarate, can be converted to succinate coupled with reduction of NADH. The second electron acceptor, nitrate, can be converted to nitrite and then ammonium. The complete reduction of nitrate to ammonium can recycle up to 4 mol NADH per mol nitrate. The third electron acceptor is based on introduction of the foreign 1,3-propanediol-producing pathway into E. coli. This pathway requires two enzymes, glycerol dehydratase (dhaB) and 1,3-propanediol oxidoreductase (dhaT), that are absent in native E. coli (18). The conversion of glycerol to 1,3-propanediol can then recycle 1 mol NADH per mol glycerol. The fourth electron sink is provided by activation of the methylglyoxal pathway to produce 1,2-propanediol.
TABLE 1.
Effect of external electron acceptors on glycerol fermentation for wild-type strain MG1655/pLOI297 and mutant TCS099/pLOI297a
| Conditions | Source of external electron acceptor pathways | Total no. of EMs | No. of anaerobic EMs | No. of anaerobic biomass-producing EMs | Range of ethanol yield (g ethanol/g glycerol)b |
|---|---|---|---|---|---|
| No reaction deleted | None | 15,374 | 18 | 0 | 0.00-0.50 |
| Fumaratec | 42,214 | 3,636 | 3,019 | 0.00-0.50 | |
| Nitrated | 27,638 | 938 | 920 | 0.02-0.50 | |
| Production of 1,3-propanediole | 20,206 | 2,024 | 1,631 | 0.00-0.50 | |
| Production of 1,2-propanediolf | 19,687 | 218 | 106 | 0.00-0.50 | |
| Eight reactions deleted | None | 28 | 8 | 0 | 0.50-0.50 |
| Fumarate supply | 28 | 8 | 0 | 0.50-0.50 | |
| Nitrate supply | 41 | 16 | 8 | 0.35-0.50 | |
| Production of 1,3-propanediol | 45 | 24 | 8 | 0.35-0.50 | |
| Production of 1,2-propanediol | 35 | 14 | 4 | 0.25-0.50 |
In all cases the total number of EMs includes the presence of O2 as an electron acceptor in the growth medium.
Data are shown only for anaerobic growth conditions.
Fumarate as a feeding substrate serves as an electron sink when fumarate is converted to succinate in the Krebs cycle in the following reaction: 1 FUM + 1 NADH = 1 SUCC + 1 NAD, where FUM is fumarate and SUCC is succinate. Fumarate cannot be used by the mutant since the fumarate reductase encoded by frd was disrupted and this stopped the conversion of fumarate to succinate.
Nitrate as a feeding substrate serves as an electron sink when nitrate is converted to either nitrite or ammonium in the following reactions: 1 nitrate + 1 NADH = 1 nitrite + 1 NAD and 1 nitrite + 3 NADH = 1 NH3 + 3 NAD.
E. coli does not have a native pathway to convert glycerol into 1,3-propanediol. However, foreign genes can be cloned and introduced into E. coli to catalyze the following two reactions: 1 GLY = 1 3-HPA and 1 3-HPA + 1 NADH = 1 1,3-PDO + 1 NAD, where GLY is glycerol, 3-HPA is 3-hydroxypropionic acid, and 1,3-PDO is 1,3-propanediol.
The production of 1,2-propanediol can be carried out through the methylglyoxal pathway by native E. coli. This pathway involves the following three main enzymatic reaction steps: for MGP1, 1 DHAP = 1 MG; for MGP3, 1 MG + 1 NADPH = 1 acetol + 1 NADP; and for MGP4, 1 acetol + 1 NADH = 1 1,2-PDO + 1 NAD, where 1,2-PDO is 1,2-propanediol, DHAP is dihydroxyacetone phosphate, and MG is methylglyoxal.
We included utilization of these electron acceptors in the E. coli metabolic network model. With EM analysis, we examined whether cell growth is feasible under anaerobic growth conditions when electron acceptors are provided. The analysis for a negative control without any external electron acceptor showed that wild-type E. coli cannot grow anaerobically on glycerol, as expected, presumably because the redox potential is imbalanced with accumulation of high levels of NADH (Table 1). Wild-type E. coli can carry out anaerobic conversion of glycerol only in the presence of external electron acceptors. However, it is not efficient in converting glycerol to ethanol due to the existence of many inefficient pathways, resulting in a wide range of ethanol yields (Table 1).
For specific application of ethanol production, supply of fumarate or use of either the 1,3-propanol-producing pathway or the 1,2-propanol-producing pathway to enable anaerobic growth in E. coli may not be practical due to the high cost of electron acceptors or due to the production of associated by-products and their associated inhibitory effects. Nitrate appears to be a good candidate for an electron acceptor because when it is reduced to ammonium, it can be directly used as a nitrogen source. However, the formation of intermediate metabolites, such as nitrite and nitrogen monoxide, adversely affects cell growth (data not shown). Further metabolic engineering of nitrate reduction may be needed for fermentation of glycerol. For these reasons, we instead considered glycerol cultivation in a microaerobic environment where oxygen was used as an external electron acceptor.
Strain design.
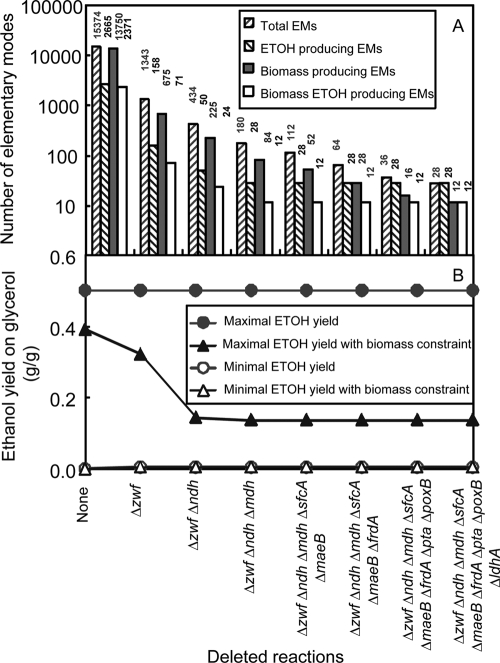
EM analysis was used to rationally design an efficient E. coli strain for conversion of glycerol to ethanol, similar to the previously demonstrated conversion of sugars to ethanol (21). The analysis identified a total of 15,374 EMs in wild-type E. coli (Fig. 1A). Of these EMs, 15,356 are aerobic. Only 18 EMs are anaerobic, but they do not support cell growth. This result is consistent with the well-known observation that E. coli cannot metabolize glycerol anaerobically (18).
FIG. 1.
Effects of deletion of multiple reactions on the number of EMs (A) and the biomass and ethanol yields (B). ETOH, ethanol.
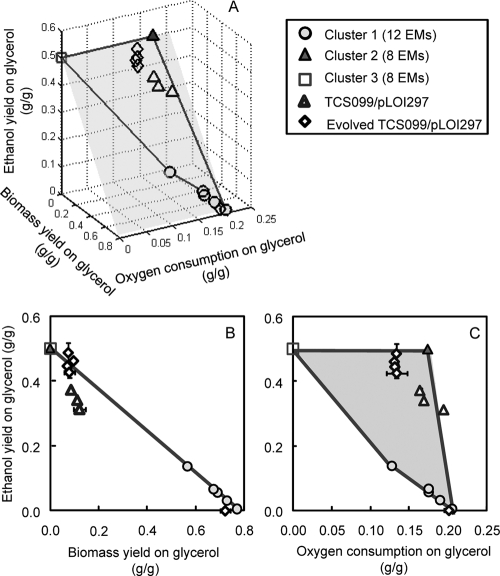
Based on previously described rules (21), we identified a set of nine gene knockout mutations that result in possible pathways with high-yield conversion of glycerol to ethanol. Deletion of eight reactions encoded by nine genes (Δzwf Δndh Δmdh ΔsfcA ΔmaeB ΔfrdA Δpta ΔpoxB ΔldhA) reduced the total of 15,374 EMs to 28 EMs. All of these 28 EMs produce ethanol. Twelve of these 28 EMs coproduce biomass and ethanol aerobically. They are represented by cluster 1 in Fig. 2. The eight additional EMs in cluster 2 can produce ethanol aerobically with a theoretical yield of 0.50 g ethanol/g glycerol without biomass synthesis. Also, after nine gene knockouts, the number of anaerobic EMs was reduced from 18 to 8, as shown in cluster 3 of Fig. 2. These anaerobic EMs produce only ethanol at the theoretical yield without biomass synthesis. With nine gene knockout mutations, the number of biomass-producing EMs was equal to the number of EMs that coproduced biomass and ethanol with a yield of ethanol in the range from 0.005 to 0.14 g ethanol/g glycerol (Fig. 1A). This indicates that cell growth and ethanol production are coupled, and cell growth without ethanol formation is not expected to be feasible.
FIG. 2.
(A) 3-D solution space of mutant TCS099/pLOI297 with the ethanol yield expressed as a function of the biomass yield and oxygen consumption on glycerol. This solution space of the mutant is enclosed in the area constructed from the lines connecting clusters of EMs and situated on the shaded plane. (B) Projection of the 3-D solution space of the mutant on the 2-D space of the ethanol and biomass yields. The inverse relationship of the ethanol and biomass yields on glycerol of the mutant is indicated by a perfect-fit line connecting clusters of EMs as follows: YEtOH/GLY = −0.64·YX/GLY + 0.50 (R2 = 1), where YEtOH/GLY is the ethanol yield on glycerol (in g ethanol/g glycerol) and YX/GLY is the biomass yield on glycerol (in g biomass/g glycerol). (C) Projection of the 3-D solution space of the mutant on the 2-D space of the ethanol yield and the oxygen consumption on glycerol. In each panel, the circles, filled triangles, and squares indicate clusters of EMs, while the open triangles and open diamonds indicate experimental data for mutant TCS099/pLOI297 and TCS099/pLOI297 evolved mutants, respectively, for different kLa values. The open diamond located at the point with the lowest ethanol yield and highest biomass yield indicates the result of the experiment conducted with an elevated kLa (2/min).
Figure 2A shows the three-dimensional (3-D) solution space of the designed mutant with the ethanol yield expressed as a function of the biomass yield and oxygen consumption on glycerol. The solution space of the mutant is restricted to the area constructed from the lines connecting the clusters of EMs of the mutant. This solution space of the mutant lies on the shaded plane. As shown in Fig. 2B, projection of the 3-D solution space of the mutant on the two-dimensional (2-D) space of the ethanol and biomass yields results in a line connecting clusters of EMs of the mutant. In Fig. 2B, the entire solution space of possible pathways is defined by the area between the ordinate, the abscissa, and the line connecting the EMs producing the low and high levels of ethanol. The wild type is not constrained and can operate anywhere in this solution space. For the designed strain, however, this space is restricted to only the line that shows an inversely proportional relationship of biomass and ethanol yields on glycerol (Fig. 2B). A decrease in the biomass yield results in an increase in the ethanol yield and vice versa. This trend may not be applicable to the wild type because it contains many pathways that form biomass without ethanol production. In other words, the wild type can function with any ethanol yield value, independent of biomass formation. In this case, a decrease in the biomass yield does not necessarily lead to an increase in the ethanol yield since the carbon flux is directed to other processes, such as production of other by-products and/or maintenance energy.
Operation of the designed strain can be located anywhere on the line shown in Fig. 2B by a nonnegative, linear combination of available EMs that all fall on this line. This metabolic operation depends on the growth conditions and cellular regulation. Therefore, we first focused on identifying optimal growth conditions such that the designed strain can function at a point on the line with a high level of conversion of glycerol to ethanol. It should be noted that the designed mutant can ferment glycerol in the presence of external electron acceptors similar to the wild type, except for the electron acceptor fumarate since fumarate reductase (frdA) is deleted in the designed mutant. In contrast to the wild type, the mutant functions only using the efficient ethanol-producing pathways that couple cell growth and ethanol production (Table 1).
Identification of optimal growth conditions guided by EM analysis.
During the growth-associated ethanol production phase, pathways that make biomass and pathways that make ethanol are the two types of pathways competing for the same glycerol carbon source. As shown in Fig. 2B, the ethanol yields are inversely proportional to the biomass yields. This inverse relationship also applies to oxygen conversion and the ethanol yield on glycerol (Fig. 2C). For growth with sufficient oxygen, the designed strain can produce biomass with yields as high as 0.77 g biomass/g glycerol, but the ethanol yields are as low as 5.10 mg ethanol/g glycerol (as shown in Fig. 1B and for cluster 1 in Fig. 2). In contrast, when growth takes place with less oxygen consumption, the mutant can potentially make ethanol with yields close to the theoretical yield, which is 0.50 g ethanol/g glycerol (as shown in Fig. 1B and for cluster 2 in Fig. 2). Therefore, this analysis demonstrates that the ethanol yield is very sensitive to the oxygen consumption and that the optimal conversion of glycerol to ethanol occurs under O2-limiting growth conditions. Limitation of oxygen consumption could be created under microaerobic growth conditions that likely would result in higher ethanol yields. It should be noted that in Fig. 2C the functional space of the mutant is enclosed by the shaded area constructed by the lines connecting the clusters of EMs of the mutant. For a given biomass yield, the ethanol yield can theoretically be determined for the designed strain located at a point on the line (Fig. 2B). A horizontal ethanol yield line can be drawn to go through this value in Fig. 2C. The intersection of this horizontal line and the lines in Fig. 2C determines the lower and upper boundaries of the theoretical oxygen consumption requirements.
Strain construction.
Up to this point the glycerol-converting cell was designed based entirely on model predictions. To experimentally verify the predictions, we constructed strain TCS099/pLOI297, which contains the nine gene knockouts (Δzwf Δndh Δmdh ΔsfcA ΔmaeB ΔfrdA Δpta ΔpoxB ΔldhA). TCS099/pLOI297 was derived from the efficient ethanologenic strain TCS083/pLOI297 that was designed and characterized previously (21). In TCS099/pLOI297 only one additional gene (mdh) is knocked out. All chromosomal knockout genes in TCS099/pLOI297 were verified by PCR (see Fig. S1 in the supplemental material).
Coupling of cell growth and ethanol production.
To demonstrate that the designed mutant TCS099 couples cell growth with ethanol formation, we conducted growth experiments in 15-ml aerobic shake tubes containing 5 ml (working volume) of defined medium. This defined medium contained 20 g/liter of glycerol and no antibiotics. The test strain was TCS099, while the control strains were MG1655, MG1655/pLOI297, and TCS099/pLOI297. Strains harboring plasmid pLOI297 contain the ethanol-producing pathway. We also used Luria-Bertani medium as a positive control. As expected, MG1655 and MG1655/pLOI297 were able to grow on the defined medium and the complex medium since the wild type still has many possible pathway options to function without forming ethanol. In contrast, mutant TCS099 without plasmid pLOI297 was not able to grow on the defined medium, presumably due to the lack of the ethanol-producing pathway. However, after the plasmid was introduced, TCS099/pLOI297 was able to grow in the defined medium (data not shown).
Metabolic evolution.
We performed metabolic evolution experiments with both wild-type strain MG1655/pLOI297 and mutant TCS099/pLOI297 under identical growth conditions. At the beginning of metabolic evolution, the wild type started with a specific growth rate on glycerol of 0.27 ± 0.06/h, while the mutant began with a specific growth rate on glycerol of 0.33 ± 0.02/h. For both the wild type and the mutant, improvements in the specific growth rate took place at a high rate during the first 150 generations of metabolic evolution (Fig. 3). The rate of improvement slowed between generations 150 and 350, and the specific growth rates become stabilized between generations 350 and 500. At the end of the metabolic evolution experiment, the specific growth rate of the evolved wild type was 0.68 ± 0.02/h and was 2.52-fold higher than that of its parent. Exhibiting a similar trend, the specific growth rate of the evolved mutant was 0.60 ± 0.03/h and was 1.82-fold higher than that of its parent.
FIG. 3.
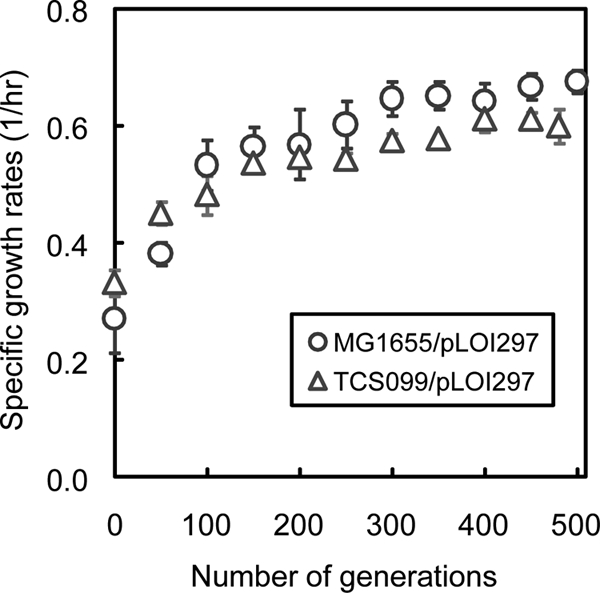
Dynamic changes in the specific growth rates of wild-type strain MG1655/pLOI297 and TCS099/pLOI297 through metabolic evolution.
Figure 3 shows the means and standard deviations of three replicate independent experiments conducted under identical growth conditions. It is interesting that the error bars are smaller toward the end of metabolic evolution for both strains. This result indicates that the variants of each evolved strain appeared to converge to the same specific growth rate at the end of metabolic evolution.
Strain performance during O2-limited growth.
Using identical growth conditions, we determined the performance of several different strains, including wild-type strain MG1655/pLOI297, evolved wild-type strain MG1655 e50rep3/pLOI297, mutant TCS099/pLOI297, and evolved mutant TCS099 e50rep1/pLOI297. The growth conditions used included aeration that resulted in a kLa of 0.3/min. Figure 4 shows the percentage of DO during the first 24 h of cell cultivation. In all cases, there was no DO detected after the first 16 h, indicating that oxygen became limiting. After the DO concentration reached zero, the oxygen transfer rate was equal to the oxygen uptake rate. This rate was determined by using the parameter kLa.
FIG. 4.
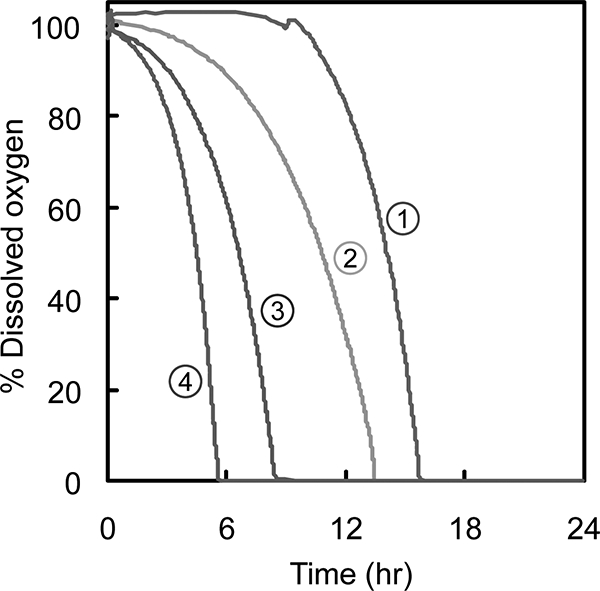
Percentages of DO for the wild type and the mutant and their evolved derivatives in batch bioreactors during the first 24 h at a kLa of 0.3/min. Line 1, MG1655/pLOI297; line 2, TCS099/pLOI297; line 3, MG1655 e50rep3/pLOI297; line 4, TCS099 e50rep1/pLOI297.
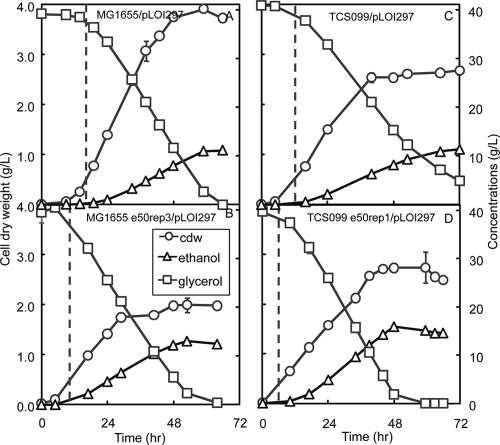
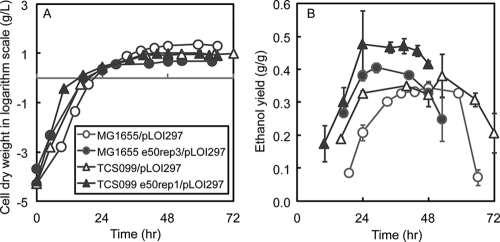
Figure 5 shows the performance of the wild type, the mutant, and the corresponding evolved derivatives isolated at the end of the metabolic evolution experiments in well-controlled batch bioreactors. At the beginning of cell cultivation, when oxygen was not limiting (DO concentration, >0%), all strains grew at the highest rates and produced mainly biomass (Fig. 5 and 6A). All the evolved strains grew faster than their parents. When oxygen became limiting (when there was no DO) (Fig. 5), the growth rates of all strains decreased and ethanol production became dominant (Fig. 5 and 6B). After 24 h, all strains had similar biomass titers. It is also interesting that under oxygen limitation conditions the rates of production of ethanol and biomass, together with the rate of consumption of glycerol, exhibited zero-order kinetics, as expected for oxygen mass transfer-limited growth (Fig. 5).
FIG. 5.
Time profiles for glycerol concentration, ethanol concentration, and cell dry weight for the wild type (A), evolved wild-type strain MG1655 e50rep3/pLOI297 (B), mutant TCS099/pLOI297 (C), and evolved mutant TCS099 e50rep1/pLOI297 (D). The dashed vertical line in each panel indicates the time that the DO level in the batch bioreactor reached zero. The strains were cultivated in controlled batch bioreactors using defined medium containing 40 g/liter of glycerol. The growth conditions were microaerobic with a kLa of 0.3/min. cdw, cell dry weight.
FIG. 6.
 ] was determined by using the following formula:
  |
To compare strain performance quantitatively under identical growth conditions, we analyzed growth parameters when oxygen became limiting. It took the wild type about 72 h to convert 40 g/liter of glycerol to ethanol with a yield of 0.32 ± 0.01 g ethanol/g glycerol, while the evolved wild type completed the conversion in around 60 h and exhibited a higher yield (0.37 ± 0.00 g ethanol/g glycerol). The mutant converted about 40 g/liter of glycerol to ethanol with a yield of 0.34 ± 0.00 g ethanol/g glycerol at around 72 h, while the evolved mutant exhibited a higher ethanol yield (0.45 ± 0.01 g ethanol/g glycerol) at around 48 h. Mutant TCS099/pLOI297 exhibited an ethanol yield that was 6% higher than that exhibited by the wild type. With the evolved mutant TCS099 e50rep1/pLOI297 there was a significant improvement in the ethanol yield, which was 32% higher than that of its parent strain, 41% higher than that of the wild type, and 22% higher than that of the evolved wild type. In general, we observed that all the evolved derivatives exhibited improvements in both the ethanol yield and the ethanol volumetric productivity compared to their parent strains.
During the growth-associated phase at a kLa of 0.3/min, mutant TCS099/pLOI297 exhibited a biomass yield of 0.11 ± 0.01 g biomass/g glycerol. Based on the model, the predicted ethanol yield based on this biomass yield is 0.43 ± 0.00 g ethanol/g glycerol and is slightly higher than the experimental ethanol yield (0.34 ± 0.00 g ethanol/g glycerol) (Fig. 2B and Table 2). Under identical growth conditions, the evolved mutant TCS099 e50rep1/pLOI297 exhibited a biomass yield of 0.07 ± 0.01 g biomass/g glycerol. The corresponding predicted ethanol yield was 0.45 ± 0.00 g ethanol/g glycerol, which matches the experimental ethanol yield (0.45 ± 0.01 g ethanol/g glycerol) (Fig. 2B and Table 2). The experimental oxygen yields on glycerol of the mutant and the evolved mutant in most cases fell into the predicted ranges (Fig. 2C).
TABLE 2.
Predicted ethanol yields for mutant TCS099/pLOI297 and its evolved derivatives
| Strain | kLa (/min) | Biomass yield (g/g)a | Exptl ethanol yield (g/g) | Predicted ethanol yield (g/g)b |
|---|---|---|---|---|
| TCS099/pLOI297 | 0.15 | 0.09 ± 0.00 | 0.37 ± 0.01 | 0.44 ± 0.00 |
| TCS099/pLOI297 | 0.2 | 0.12 ± 0.03 | 0.31 ± 0.01 | 0.42 ± 0.02 |
| TCS099/pLOI297 | 0.3 | 0.11 ± 0.01 | 0.34 ± 0.00 | 0.43 ± 0.00 |
| TCS099 e50rep1/pLOI297 | 0.15 | 0.07 ± 0.00 | 0.49 ± 0.03 | 0.45 ± 0.00 |
| TCS099 e50rep1/pLOI297 | 0.2 | 0.10 ± 0.01 | 0.46 ± 0.01 | 0.44 ± 0.01 |
| TCS099 e50rep1/pLOI297 | 0.3 | 0.07 ± 0.01 | 0.45 ± 0.01 | 0.45 ± 0.00 |
Experimentally determined.
The predicted ethanol yields were determined by using the equation YEtOH/GLY = −0.64·YX/GLY + 0.50, which was derived from the overall stoichiometric equations for the efficient ethanol production pathways (Fig. 2B).
Performance of evolved variants during O2 limitation.
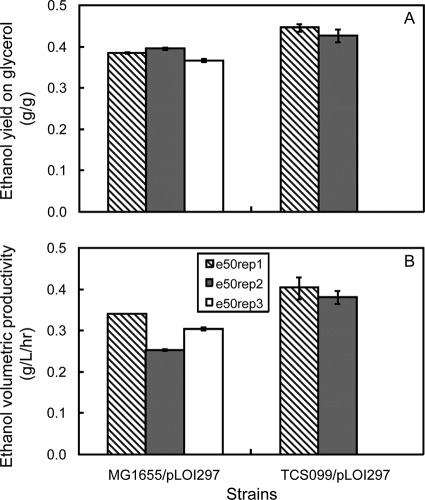
Even though the specific growth rates of evolved derivatives originating from the same parent strain converged to the same value in three independent replicate experiments, it was possible that the metabolic flux distributions of these derivatives could differ and result in different ethanol yields and productivities. To examine this possibility, we determined the kinetics of growth and ethanol formation for all variants under identical growth conditions at a kLa of 0.3/min. As shown in Fig. 7, the ethanol yields and productivities of different evolved derivatives originating from the same parents showed similar improvements. The evolved variants of the wild type exhibited an average ethanol yield of 0.38 ± 0.01 g ethanol/g glycerol and an average ethanol productivity of 0.30 ± 0.04 g ethanol/liter/h, while the evolved variants of the mutant exhibited an average ethanol yield of 0.44 ± 0.02 g ethanol/g glycerol and an average ethanol productivity of 0.39 ± 0.02 g ethanol/liter/h. In all cases, the evolved mutants showed greater improvements in the ethanol yields and productivities than their parents, the wild type, and the evolved wild type. The variants of the evolved mutants could exhibit ethanol yields that matched the theoretical predicted ethanol yields closely (Fig. 2 and Table 2).
FIG. 7.
Ethanol yields (A) and ethanol volumetric productivities (B) of variants of evolved derivatives at a kLa of 0.3/min.
Effect of kLa on ethanol yields and productivities.
To optimize ethanol production, we varied the parameter kLa by varying the agitation rate while other growth parameters, such as the airflow rate supplied to the bioreactor, temperature, and pH, were kept constant. This enabled precise control of the oxygen transfer rate in a microaerobic growth environment. We adjusted the kLa to three values (0.15, 0.2, and 0.3/min) and tested wild-type strain MG1655/pLOI297, the TCS099/pLOI297 mutant, and the evolved mutant TCS099 e50rep1/pLOI297 under these conditions.
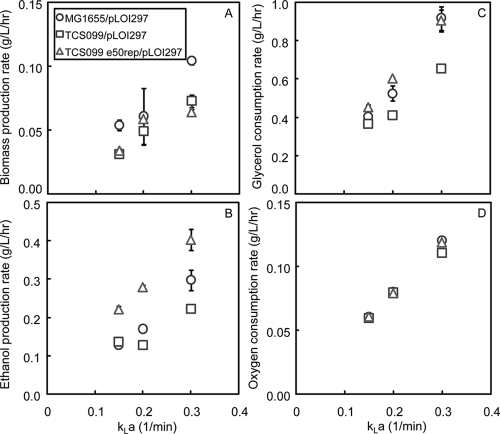
In general, as the kLa values were increased, all rates, including the biomass and ethanol production rates, as well as the glycerol and oxygen consumption rates, also increased (Fig. 8). The oxygen consumption rates were very similar for the strains tested because these strains were characterized under the same O2 transfer rate conditions. In contrast to the oxygen consumption rates, the other rates did not increase similarly for the strains tested because each strain has different metabolic responses to variation in the oxygen supply. Of the characterized strains, the evolved mutant TCS099 e50rep1/pLOI297 exhibited the best performance with the highest ethanol production rates at all kLa values tested.
FIG. 8.
Effect of kLa on the biomass production rate (A), on the ethanol production rate (B), on the glycerol consumption rate (C), and on the oxygen consumption rate (D) for MG1655/pLOI297, TCS099/pLOI297, and TCS099 e50rep1/pLOI297.
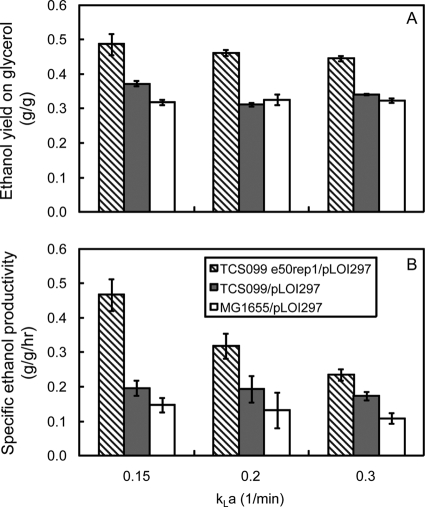
Figure 9A shows the effect of kLa on ethanol yields. The wild type exhibited similar ethanol yields (0.32 g ethanol/g glycerol) for all kLa values tested. The TCS099/pLOI297 mutant exhibited a higher ethanol yield (0.37 ± 0.01 g ethanol/g glycerol) at a kLa of 0.15/min. This high yield of the mutant decreased substantially to 0.31 ± 0.01 and 0.34 ± 0.00 g ethanol/g glycerol when the kLa was increased to 0.2 and 0.3/min, respectively. The evolved mutant TCS099 e50rep1/pLOI297 exhibited the highest ethanol yield, 0.49 ± 0.03 g ethanol/g glycerol, which was close to 97% of the theoretical ethanol yield at a kLa of 0.15/min. The ethanol yields were lower, 0.46 ± 0.01 and 0.45 ± 0.01 g ethanol/g glycerol, when the kLa values were 0.2 and 0.3/min, respectively.
FIG. 9.
Effect of kLa on the ethanol yield (A) and on the specific ethanol productivity (B) for MG1655/pLOI297, TCS099/pLOI297, and TCS099 e50rep1/pLOI297.
The evolved mutant TCS099 e50rep1/pLOI297 exhibited a very interesting phenotype compared to its parent strain (TCS099/pLOI297) and wild-type strain MG1655/pLOI297. At low kLa values, such as 0.15/min, the evolved mutant exhibited a much lower biomass titer than its parent strain and the wild type (Fig. 10), but it was able to produce ethanol with a higher yield and higher productivity (Fig. 9). The specific ethanol productivities of wild-type strain MG1655/pLOI297 and mutant TCS099/pLOI297 were similar for all values of kLa tested. However, the specific ethanol productivities of the evolved mutant decreased as the value of kLa increased, presumably due to the increase in the biomass production. This trend is also consistent with the slight decrease in the ethanol yield because the increase in oxygen supply results in redirection of more carbon source from glycerol to biomass synthesis.
FIG. 10.
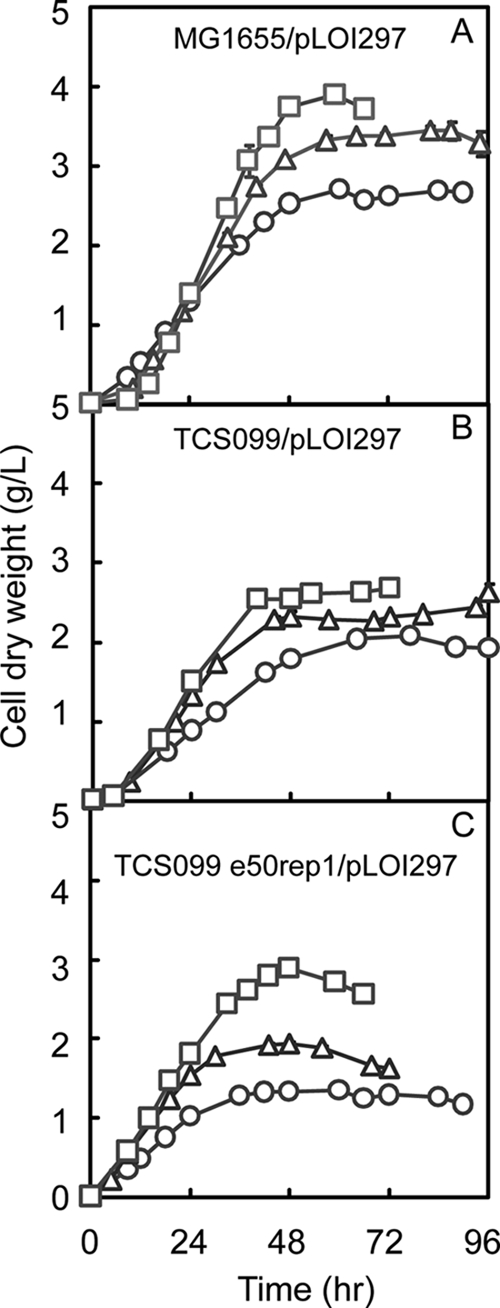
Profiles of cell dry weight for wild-type strain MG1655/pLOI297 (A), mutant TCS099/pLOI297 (B), and evolved mutant TCS099 e50rep1/pLOI297 (C) at kLa values of 0.15/min (open circles), 0.2/min (open triangles), and 0.3/min (open squares).
We also investigated the performance of the evolved mutant TCS099 e50rep1/pLOI297 for a kLa of 0.1/min. Under these microaerobic growth conditions, the trends of ethanol yield and volumetric ethanol productivity were reversed. The ethanol yield decreased from 0.49 ± 0.03 g ethanol/g glycerol to 0.35 ± 0.00 g ethanol/g glycerol when the kLa was decreased from 0.15/min to 0.1/min. Similarly, the volumetric ethanol productivity dropped from 0.46 ± 0.02 g/liter/h to 0.08 ± 0.01 g/liter/h. The reverse trends were presumably triggered by the imbalance of the redox state resulting from the limited supply of oxygen.
Microaerobic growth conditions optimal for conversion of glycerol to ethanol.
As shown in Fig. 5, when oxygen was not limiting initially, all of the strains characterized produced mainly biomass. Only when oxygen became limiting did the strains start producing ethanol. This trend can be clearly seen by examining the instantaneous ethanol yields shown in Fig. 6B. The instantaneous ethanol yields increased when oxygen became limiting and reached stable values before glycerol was exhausted. Therefore, microaerobic growth conditions are optimal for converting glycerol to ethanol.
This is also shown by the effect of kLa on the performance of the evolved mutant TCS099 e50rep1/pLOI297. An increase in the kLa value from 0.15 to 0.3/min resulted in a decrease in the theoretical ethanol yield from 97% to 89%. At an elevated kLa (2/min) TCS099 e50rep1/pLOI297 produced mainly biomass instead of ethanol when the oxygen supply was sufficient (Fig. 2).
DISCUSSION
We used EM analysis to rationally design an E. coli mutant with minimized metabolic functionality tailored for efficient conversion of glycerol to ethanol. The mutant contains nine gene knockouts (Δzwf Δndh ΔsfcA ΔmaeB ΔldhA ΔfrdA ΔpoxB Δpta Δmdh) that couple cell growth with ethanol formation under aerobic growth conditions on glycerol.
The remaining EMs define the phenotypic space of the mutant (Fig. 2), which suggests that oxygen-limited growth conditions are best for efficiently converting glycerol to ethanol. Under such conditions cells maximize the rate of glycerol consumption while they are still able to grow. The EM analysis also revealed that glycerol fermentation is not feasible due to a redox imbalance (e.g., accumulation of high levels of NADH without sufficient electron acceptors that could be used as a sink). Glycerol fermentation occurs only when additional external electron acceptors are supplied. E. coli can use its native 1,2-propanediol-producing pathway to balance the redox state. However, operation of this pathway requires synthesis of the precursor methyglyoxal from the methylglyoxal pathway that is toxic for cell growth (19). Indeed, glycerol fermentation was not observed in defined medium in our studies, which is consistent with results described by others (8, 18).
In the designed mutant the level of oxygen available plays a key role in controlling the competition between the biomass formation and ethanol production pathways with the same glycerol carbon source (Fig. 2). Precise control of the oxygen supply can direct the carbon flow toward ethanol production rather than toward biomass synthesis. As demonstrated here, the evolved mutant can convert glycerol to ethanol with an ethanol yield as high as 97% of the theoretical limit in defined medium under oxygen-limiting growth conditions at a kLa of 0.15/min. In contrast, it produced mainly biomass and not ethanol with a sufficient oxygen supply at a kLa of 2/min. A sufficient oxygen supply likely can enhance the generation of ATP used for biomass synthesis by reducing NADH and hence drain more carbon flux for biomass production but less carbon flux for ethanol synthesis. However, with oxygen limitation, the accumulation of NADH becomes significant and can be relieved only by the ethanol production pathway that serves as an electron sink. This pathway is purposely enforced for full operation in the designed mutant, in contrast to the wild type. As demonstrated here, the wild type made a significant amount of succinate that helped recycle NADH (Fig. 11), while the mutant used the ethanol production pathway primarily to recycle NADH.
FIG. 11.
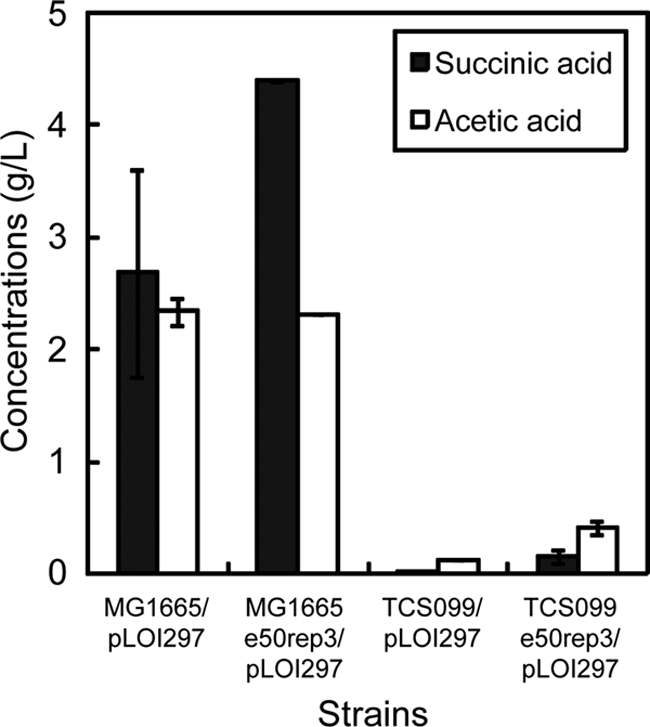
Concentrations of accumulated by-products of the wild type and the mutant and their evolved derivatives for microaerobic growth at a kLa of 0.3/min.
The unique design of the mutant involves the coupling of cell growth and ethanol production under aerobic growth conditions. This design characteristic was useful in the directed evolution experiment based on serial dilution of the cell cultures. Such serial dilution experiments are easier to perform aerobically than anaerobically. Also, the higher growth rates under aerobic growth conditions help shorten the evolution time. Furthermore, the design provides an advantageous selection pressure that can allow the designed mutant to overcome cellular regulation to improve ethanol productivity. The mutant is restricted to evolve only in the context of designed remaining pathways that do not include the inefficient pathways still present in the wild-type strain. As shown in Fig. 11, compared to the corresponding parent strain, the evolved wild type produced large quantities of succinic acid and acetic acid in the batch growth studies, while the evolved mutant did not.
Local control of rate-limiting reactions with low enzyme capacities likely determines how the carbon flow is distributed between biomass production and ethanol production. The enzyme capacities in the rate-limiting reactions can be manipulated naturally through directed evolution with selection of cells having improved cell growth and ethanol production. The evolved mutants have higher specific growth rates and associated specific glycerol uptake rates that are likely consequences of overcoming restrictions in cellular regulation (Fig. 3; see Table S2 in the supplemental material). This facilitates direction of the carbon flux to ethanol production rather than to biomass synthesis. The increases in the specific glycerol uptake rates in the evolved mutants are likely associated with the increases in the glycerol kinase fluxes. Indeed, a previous study showed that the glycerol kinase step is the rate-limiting step for controlling the dissimilation of glycerol in E. coli (27).
Zwaig et al. reported that this enzyme is inhibited by the intracellular metabolite fructose-1,6-diphosphate involved in glycolysis. E. coli strains that harbor a mutated glycerol kinase resistant to the inhibition by fructose-1,6-diphosphate have higher specific growth rates. Comparative genome sequencing of five evolved wild-type E. coli MG1655 strains whose specific growth rates increased after a similar metabolic evolution experiment with glycerol showed that they contained mutated glycerol kinases involving point mutations and/or duplication of several nucleotides (12). It is likely that in the mutant generated in the present metabolic evolution study an increased glycerol kinase flux results in more NADH available for ethanol production.
TCS099/pLOI297 was derived from a mutant strain that can simultaneously convert pentoses and hexoses under anaerobic growth conditions to ethanol at similar rates with high yields (21). This strain is also able to couple cell growth and ethanol production anaerobically. However, under aerobic growth conditions, the parent still contains a large number of EMs that cannot make ethanol but can make biomass. However, additional deletion of mdh in the parent strain results in TCS099/pLOI297, which does not have aerobic EMs that make only biomass. In this mutant, all existing aerobic biomass-producing EMs coproduce ethanol. It should be noted that deletion of mdh does not affect the anaerobic EMs of the parent strain that are still present in the derived mutant. The new strain TCS099/pLOI297 possibly could be used as a host for aerobic metabolic evolution of other foreign pathways, such as the lactic acid and succinic acid production pathways that require a redox balance similar to the ethanol pathway.
Supplementary Material
Acknowledgments
We acknowledge grant GM077529 from the National Institutes of Health as financial support.
Footnotes
Published ahead of print on 4 September 2009.
Supplemental material for this article may be found at http://aem.asm.org/.
REFERENCES
- 1.Alterthum, F., and L. O. Ingram. 1989. Efficient ethanol production from glucose, lactose, and xylose by recombinant Escherichia coli. Appl. Environ. Microbiol. 55:1943-1948. [DOI] [PMC free article] [PubMed] [Google Scholar]
- 2.Baba, T., T. Ara, M. Hasegawa, Y. Takai, Y. Okumura, M. Baba, K. A. Datsenko, M. Tomita, B. L. Wanner, and H. Mori. 2006. Construction of Escherichia coli K-12 in-frame, single-gene knockout mutants: the Keio collection. Mol. Syst. Biol. 2:2006.0008. [DOI] [PMC free article] [PubMed] [Google Scholar]
- 3.Barbirato, F., C. Camarasa-Claret, J. Grivet, and A. Bories. 1995. Glycerol fermentation by a new 1,3-propanediol-producing microorganism: Enterobacter agglomerans. Appl. Microbiol. Biotechnol. 43:786-793. [Google Scholar]
- 4.Biebl, H. 1991. Glycerol fermentation of 1,3-propanediol by Clostridium butyricum. Measurement of product inhibition by use of a pH-auxostat. Appl. Microbiol. Biotechnol. 35:701-705. [Google Scholar]
- 5.Boenigk, R., S. Bowien, and G. Gottschalk. 1993. Fermentation of glycerol to 1,3-propanediol in continuous cultures of Citrobacter freundii. Appl. Microbiol. Biotechnol. 38:453-457. [Google Scholar]
- 6.Causey, T. B., S. Zhou, K. T. Shanmugam, and L. O. Ingram. 2003. Engineering the metabolism of Escherichia coli W3110 for the conversion of sugar to redox-neutral and oxidized products: homoacetate production. Proc. Natl. Acad. Sci. USA 100:825-832. [DOI] [PMC free article] [PubMed] [Google Scholar]
- 7.Centi, G. 2007. Catalysis for renewables: from feedstock to energy production. Wiley-VCH, Weinheim, Germany.
- 8.Clark, D. P. 1990. Molybdenum cofactor negative mutants of Escherichia coli use citrate anaerobically. FEMS Microbiol. Lett. 67:245-249. [DOI] [PubMed] [Google Scholar]
- 9.Coombs, A. 2007. Glycerin bioprocessing goes green. Nat. Biotechnol. 25:953-954. [DOI] [PubMed] [Google Scholar]
- 10.Dharmadi, Y., A. Murarka, and R. Gonzalez. 2006. Anaerobic fermentation of glycerol by Escherichia coli: a new platform for metabolic engineering. Biotechnol. Bioeng. 94:821-829. [DOI] [PubMed] [Google Scholar]
- 11.Forage, R. G., and E. C. Lin. 1982. DHA system mediating aerobic and anaerobic dissimilation of glycerol in Klebsiella pneumoniae NCIB 418. J. Bacteriol. 151:591-599. [DOI] [PMC free article] [PubMed] [Google Scholar]
- 12.Herring, C. D., A. Raghunathan, C. Honisch, T. Patel, M. K. Applebee, A. R. Joyce, T. J. Albert, F. R. Blattner, D. van den Boom, C. R. Cantor, and B. O. Palsson. 2006. Comparative genome sequencing of Escherichia coli allows observation of bacterial evolution on a laboratory timescale. Nat. Genet. 38:1406-1412. [DOI] [PubMed] [Google Scholar]
- 13.Karp, P. D., I. M. Keseler, A. Shearer, M. Latendresse, M. Krummenacker, S. M. Paley, I. Paulsen, J. Collado-Vides, S. Gama-Castro, M. Peralta-Gil, A. Santos-Zavaleta, M. I. Penaloza-Spinola, C. Bonavides-Martinez, and J. Ingraham. 2007. Multidimensional annotation of the Escherichia coli K-12 genome. Nucleic Acids Res. 35:7577-7590. [DOI] [PMC free article] [PubMed] [Google Scholar]
- 14.Murarka, A., Y. Dharmadi, S. S. Yazdani, and R. Gonzalez. 2008. Fermentative utilization of glycerol by Escherichia coli and its implications for the production of fuels and chemicals. Appl. Environ. Microbiol. 74:1124-1135. [DOI] [PMC free article] [PubMed] [Google Scholar]
- 15.Posfai, G., M. D. Koob, H. A. Kirkpatrick, and F. R. Blattner. 1997. Versatile insertion plasmids for targeted genome manipulations in bacteria: isolation, deletion, and rescue of the pathogenicity island LEE of the Escherichia coli O157:H7 genome. J. Bacteriol. 179:4426-4428. [DOI] [PMC free article] [PubMed] [Google Scholar]
- 16.Schuster, S., D. A. Fell, and T. Dandekar. 2000. A general definition of metabolic pathways useful for systematic organization and analysis of complex metabolic networks. Nat. Biotechnol. 18:326-332. [DOI] [PubMed] [Google Scholar]
- 17.Shuler, M. L., and F. Kargı. 2002. Bioprocess engineering: basic concepts. Prentice Hall, Upper Saddle River, NJ.
- 18.Tong, I. T., H. H. Liao, and D. C. Cameron. 1991. 1,3-Propanediol production by Escherichia coli expressing genes from the Klebsiella pneumoniae dha regulon. Appl. Environ. Microbiol. 57:3541-3546. [DOI] [PMC free article] [PubMed] [Google Scholar]
- 19.Totemeyer, S., N. A. Booth, W. W. Nichols, B. Dunbar, and I. R. Booth. 1998. From famine to feast: the role of methylglyoxal production in Escherichia coli. Mol. Microbiol. 27:553-562. [DOI] [PubMed] [Google Scholar]
- 20.Trinh, C., A. Wlaschin, and F. Srienc. 2009. Elementary mode analysis: a useful metabolic pathway analysis tool for characterizing cellular metabolism. Appl. Microbiol. Biotechnol. 81:813-826. [DOI] [PMC free article] [PubMed] [Google Scholar]
- 21.Trinh, C. T., P. Unrean, and F. Srienc. 2008. Minimal Escherichia coli cell for the most efficient production of ethanol from hexoses and pentoses. Appl. Environ. Microbiol. 74:3634-3643. [DOI] [PMC free article] [PubMed] [Google Scholar]
- 22.Trinh, C. T., R. Carlson, A. Wlaschin, and F. Srienc. 2006. Design, construction and performance of the most efficient biomass producing E. coli bacterium. Metab. Eng. 8:628-638. [DOI] [PubMed] [Google Scholar]
- 23.von Kamp, A., and S. Schuster. 2006. Metatool 5.0: fast and flexible elementary modes analysis. Bioinformatics 22:1930-1931. [DOI] [PubMed] [Google Scholar]
- 24.Wlaschin, A. P., C. T. Trinh, R. Carlson, and F. Srienc. 2006. The fractional contributions of elementary modes to the metabolism of Escherichia coli and their estimation from reaction entropies. Metab. Eng. 8:338-352. [DOI] [PubMed] [Google Scholar]
- 25.Yazdani, S. S., and R. Gonzalez. 2007. Anaerobic fermentation of glycerol: a path to economic viability for the biofuels industry. Curr. Opin. Biotechnol. 18:213-219. [DOI] [PubMed] [Google Scholar]
- 26.Zhou, S., T. B. Grabar, K. T. Shanmugam, and L. O. Ingram. 2006. Betaine tripled the volumetric productivity of d(−)-lactate by Escherichia coli strain SZ132 in mineral salts medium. Biotechnol. Lett. 28:671-676. [DOI] [PubMed] [Google Scholar]
- 27.Zwaig, N., W. S. Kistler, and E. C. Lin. 1970. Glycerol kinase, the pacemaker for the dissimilation of glycerol in Escherichia coli. J. Bacteriol. 102:753-759. [DOI] [PMC free article] [PubMed] [Google Scholar]
Associated Data
This section collects any data citations, data availability statements, or supplementary materials included in this article.


