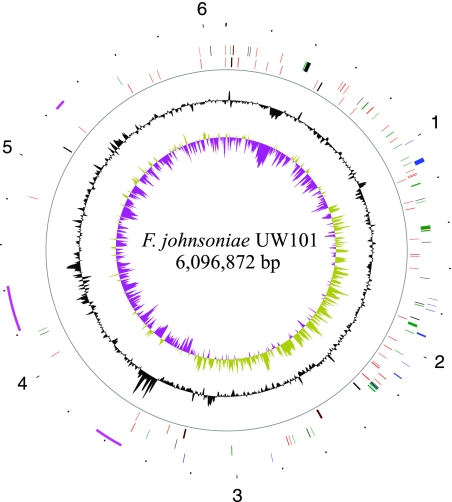
FIG. 1.
Map of the F. johnsoniae genome. The innermost circle (circle 1) shows the GC skew [(G − C)/(G + C)] (yellow-green, values more than 1; purple, values less than 1). Circle 2 shows the G+C content. Circle 3 indicates the backbone ring. Circle 4 shows rRNA (black) and tRNA (red). Circle 5 shows core protein-encoding genes, including genes encoding ribosomal proteins (black), aminoacyl tRNA synthetases (red), enzymes involved in glycolysis, the tricarboxylic acid cycle, oxidative phosphorylation, and synthesis of electron transport chain menaquinones (green), and the RNA polymerase core (teal). Circle 6 shows motility genes (blue). Circle 7 shows transposon islands (pink). The outermost circle (circle 8) shows a ruler, and the numbers indicate Mbp of sequence.

