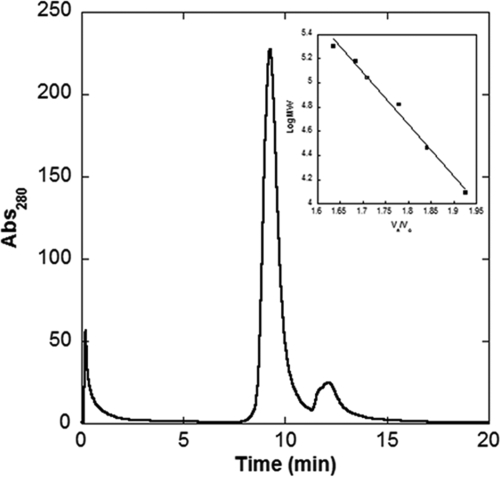
FIG. 4.
HPLC gel filtration analysis of N. gonorrhoeae GCYH-IB. GCYH-IB elutes at 9.22 min. The broad trailing peak at ∼12 min is due to a small molecule contaminant (retention time is after cytochrome c). The inset graph shows the standard curve presented as log MW versus Ve/V0 where Ve is the measured elution volume and V0 is the volume of a completed excluded solute. The protein standards β-amylase (200 kDa), alcohol dehydrogenase (150 kDa), bovine serum albumin (66 kDa), carbonic anhydrase (29 kDa), and cytochrome c (12.4 kDa) are plotted as closed squares (▪). The N. gonorrhoeae GCYH-IB data are plotted as open squares (□). Each data point represents the average of two trials. The protein standard data fit the linear regression as follows: y = 12.335 − 4.26661x (R = 0.99494). Abs280, absorbance at 280 nm.

