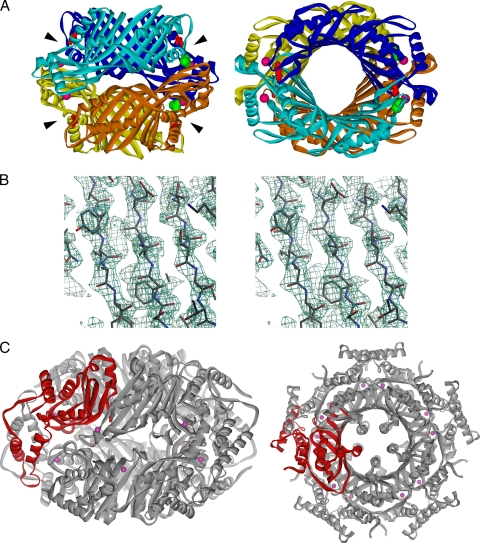
FIG. 5.
Overall structure of GCYH-IB. (A) Ribbon diagram showing a side view (left) and a top view (right) of the GCYH-IB biological tetramer. The two dimers are colored in shades of orange and blue, respectively. The four active centers harboring the metal binding sites and GTP binding pockets are located at the intersubunit interfaces and are indicated with arrowheads. Zinc ions, acetate ligands, and the conserved T-fold substrate anchor Glu216 in the active sites are shown as magenta balls, green Corey-Pauling-Koltun model, and red sticks, respectively. (B) Stereoview of a figure of merit (FOM)-weighted experimental electron density map (resolution, 2.2 Å; contour level, 1.5 σ), calculated after solvent flattening in the β-sheet region and superimposed on the refined model. The figure was prepared with Bobscript (15). (C) Ribbon diagram showing a side view (left) and a top view (right) of the homodecamer of GCYH-IA. The monomer is shown in red.

