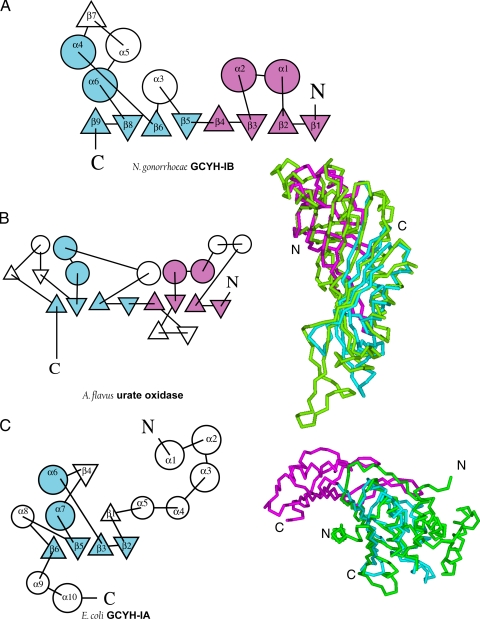
FIG. 6.
Topology of the GCYH-IB monomer and structural comparison with other T-fold enzymes. Topology diagrams of N. gonorrhoeae GCYH-IB (A), A. flavus urate oxidase (B), and E. coli GCYH-IA (C) calculated with the program TOPS (34). The N- and C-terminal modules of the core bimodular T-fold are shown in magenta and cyan, respectively. Cα trace superpositions of the N-terminal (magenta) and C-terminal (cyan) modules of GCYH-IB with corresponding enzymes (green) are shown in panels B and C. Secondary structure nomenclature is shown for the two isozymes.

