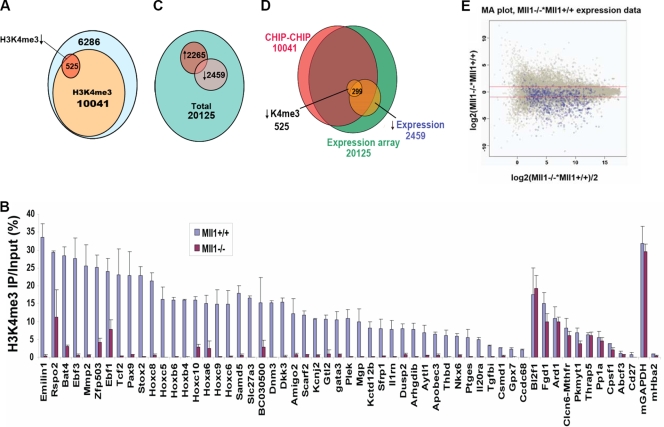
FIG. 1.
Identification of genes requiring Mll1 for H3K4 methylation and gene expression. (A) Numbers of promoters with changes in H3K4me3 levels as assessed by ChIP-chip with H3K4me3 antibodies in Mll1+/+ and Mll1−/− MEFs. Ten thousand forty-one out of 16,852 gene promoters had detectable peaks of H3K4me3 in wild-type MEFs. Only 525 (5%) of these genes showed significant loss of H3K4me3 in the absence of Mll1. (B) ChIP-qPCR analysis confirmed the H3K4me3 changes on 45 of the genes found by ChIP-chip analysis to be most changed for H3K4me3, as well as the ChIP-chip results for 10 unchanged genes. The Hemoglobin gene, inactive in fibroblasts (Hba2), was used as a negative control for H3K4me3, and the housekeeping gene Gapdh was used as a positive control for the presence of H3K4me3. Error bars show standard deviations. (C) Gene expression analysis of 20,125 genes was performed with RNA isolated from Mll1+/+ and Mll1−/− fibroblasts. The expression of 2,265 genes is upregulated and that of 2,459 genes is downregulated in the absence of Mll1. (D) Overlap of H3K4me3 and gene expression. About 299 of the 525 genes with loss of H3K4me3 also have decreased expression in the absence of Mll1. (E) Microarray (MA) plot of the gene expression data, with the 525 genes with significantly reduced H3K4 methylation highlighted in blue. The y axis represents the intensity ratio of mutant over wild type, and the x axis represents the average intensity of each spot. The red lines indicate a twofold up- or downregulation of expression. Most of the genes dependent on Mll1 for H3K4me3 show reduced expression.

