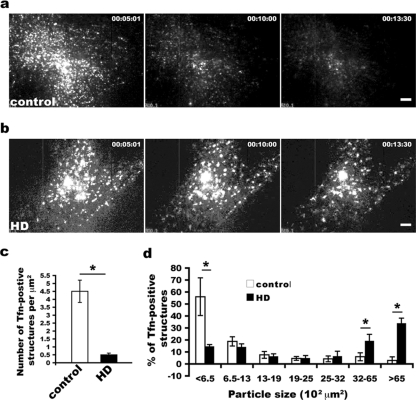
FIG. 4.
Abnormal distribution of transferrin receptor in live HD fibroblasts viewed by TIRF. (a) Small vesicles are predominant carriers of recycling cargo transferrin and gradually disappear in control fibroblasts. (b) HD cells show transferrin concentrated in large vesicular structures. a and b show TIRF images recorded at 5:01, 10:00, and 13:30 min after washout of transferrin. Scale bar, 5 μm. (c) Density (mean ± SD) of transferrin (Tfn)-positive structures per μm2 in control and HD cells (n = 5 cells for each; *, P < 0.001, determined by the Student t test). (d) Size distribution of transferrin-positive structures. The density and the size of Alexa568-transferrin labeled structures were quantified after chase for 6 min 40 s: chase for 5 min before imaging and another chase for 1 min 40 s after the start of imaging (image 100 was used for quantification). Paired cells (means ± SD) (HD and control cells imaged at the same TIRF angle setting) were analyzed using NIH ImageJ software (n = 5 pairs) (*, P < 0.001, determined by the Student t test).

