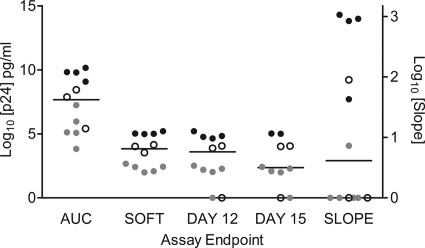
FIG. 2.
Comparison of five endpoint measures to determine HIV-1Ba-L growth in explant tissues. Viral growth determined at the endpoints SOFT, day 12, day 15, and AUC are plotted on the left y axis (log10 p24 pg/ml), while the slope was plotted on the right y axis for low ( )-, medium (○)-, and high (•)-yielding assays. Horizontal lines indicate the median of each endpoint. Note that for two of the high-level growth assays (laboratory D, donors 1 and 2), growth was measured for only 12 days.

