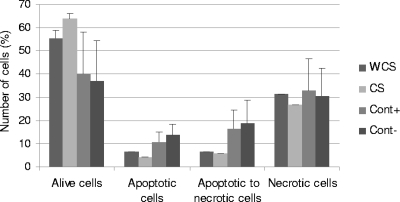
FIG. 4.
Mean percentages of bacteria at different times in the process of apoptosis for isolates from diseased and healthy animals at 6 h after beginning of phagocytosis. Data represent averages from three independent trials with standard errors (WCS and CS) or standard deviations (positive control [Cont+] and negative control [Cont−]).

