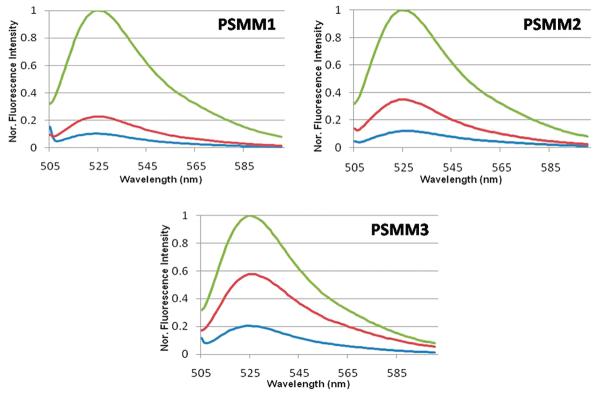
Figure 1.
Fluorescence spectra of PSMM1–3 (λex = 488 nm) from top to bottom after irradiation under a 6 W UV lamp (350 nm) and a 60 W desktop lamp with 450 nm filter at 25 °C. All other conditions are the same. The blue curve is pure DNA in buffer solution (100 nM); green line is with five times of cDNA; and red line is UV/vis irradiation. Buffer: 20 mM Tris buffer pH 8.0, Na+: 20 mM, Mg2+:2 mM, [PSMM3] = 100 nM, [cDNA] = 500 nM.

