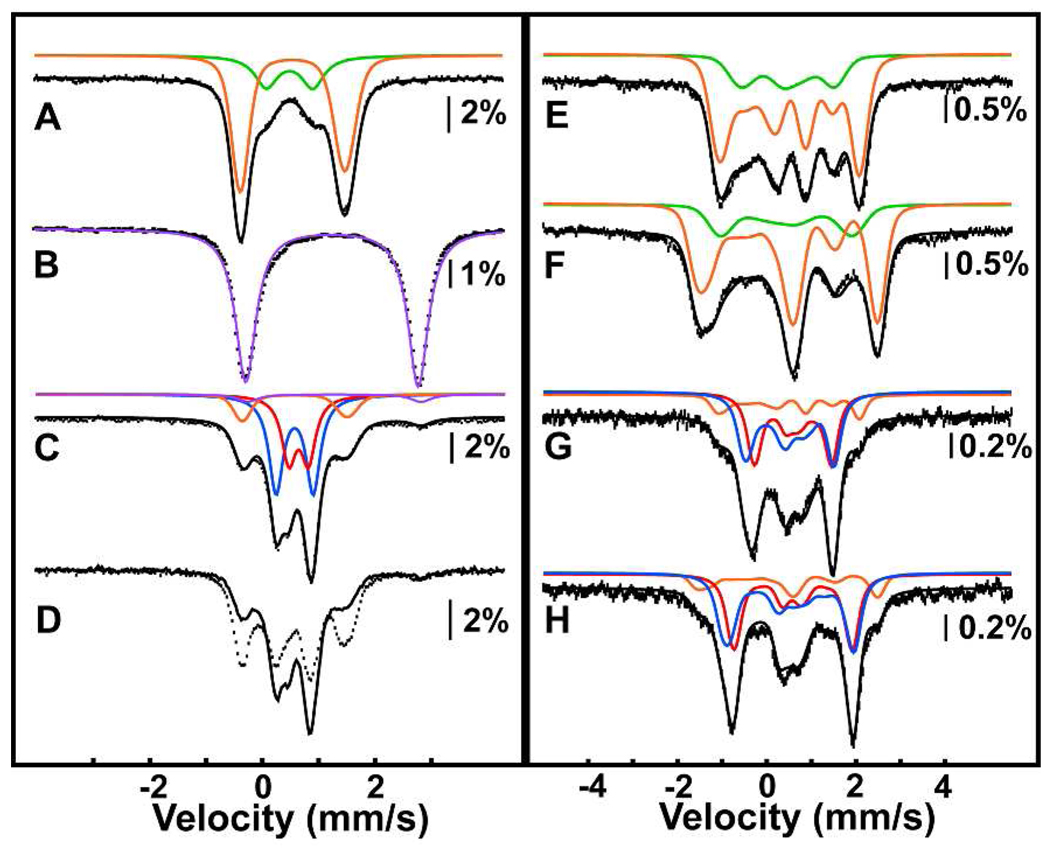
Figure 2.
4.2-K Mössbauer spectra (hashed marks) of as-isolated AurF (A, E, F); DT-reduced AurF (B); DT-reduced AurF exposed to 2 atm O2 for 2 min, and then either directly frozen for Mössbauer analysis (C) or further treated with 0.3 equiv pABA prior to being frozen for analysis (D), and DT-reduced AurF treated with a slight excess of O2 from an O2-saturated buffer solution (G, H). Spectra were collected in external fields of 53 mT (A–D), 5T (E, G), or 8T (F, H). The solid lines in A – C are simulations with parameters quoted in the text. The solid line in D is the experimental spectrum from C re-plotted to illustrate the spectral changes. The solid lines in E – H are spin Hamiltonian simulations with parameters in the text, asymmetry parameters η = -0.4 (orange), η = 1 (green), η = 1.4 (red), η = 0.3 (blue), and the assumption of S = 0 ground states for all species.

