FIG. 3.
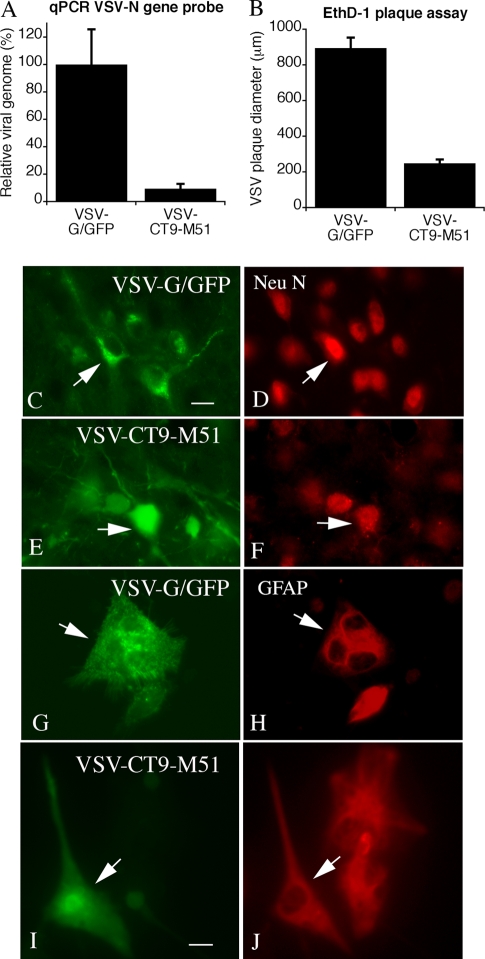
Viral loads in the brain and cellular targets of VSV-G/GFP and VSV-CT9-M51. The brains of mice injected with equal doses of VSV-G/GFP or VSV-CT9-M51 were harvested 4 days p.i. RNA from homogenized brains was reverse transcribed, and viral titers were assessed using quantitative PCR (qPCR). (A) A PCR probe spanning VSV genes N and P was used to allow detection of genomic VSV copies. Brains infected with VSV-CT9-M51 contained significantly less virus than brains infected with VSV-G/GFP after 4 days. The error bars indicate standard errors of the mean. (B) Cultures of normal mouse brain were infected with 100 PFU of VSV-G/GFP or VSV-CT9-M51 and analyzed 24 h later. Plaques were stained with ethidium homodimer (EthD-1) that stains cells killed by the virus, and the diameters of the plaques were measured. The bar graph shows the relative sizes of the plaques, with VSV-G/GFP generating the largest plaques, indicating a higher rate of infection and replication. (C to J) Viral infections (left) (green, GFP) and immunostaining of the same region (right) (red immunostain). VSV-G/GFP (C, D, G, and H) and VSV-CT9-M51 (E, F, I, and J) were used to infect mouse brains (the mice were euthanized 2 days later) (C to F) or mouse brain cultures (G to J). Red immunostaining for Neu N revealed infections of neurons (D and F), and staining for GFAP (H and J) revealed astrocyte infections. The arrows indicate infected cells that stained for the respective antigen. Scale bars, 12 μm (C through F) and 7 μm (G through J).

