
FIG. 6.
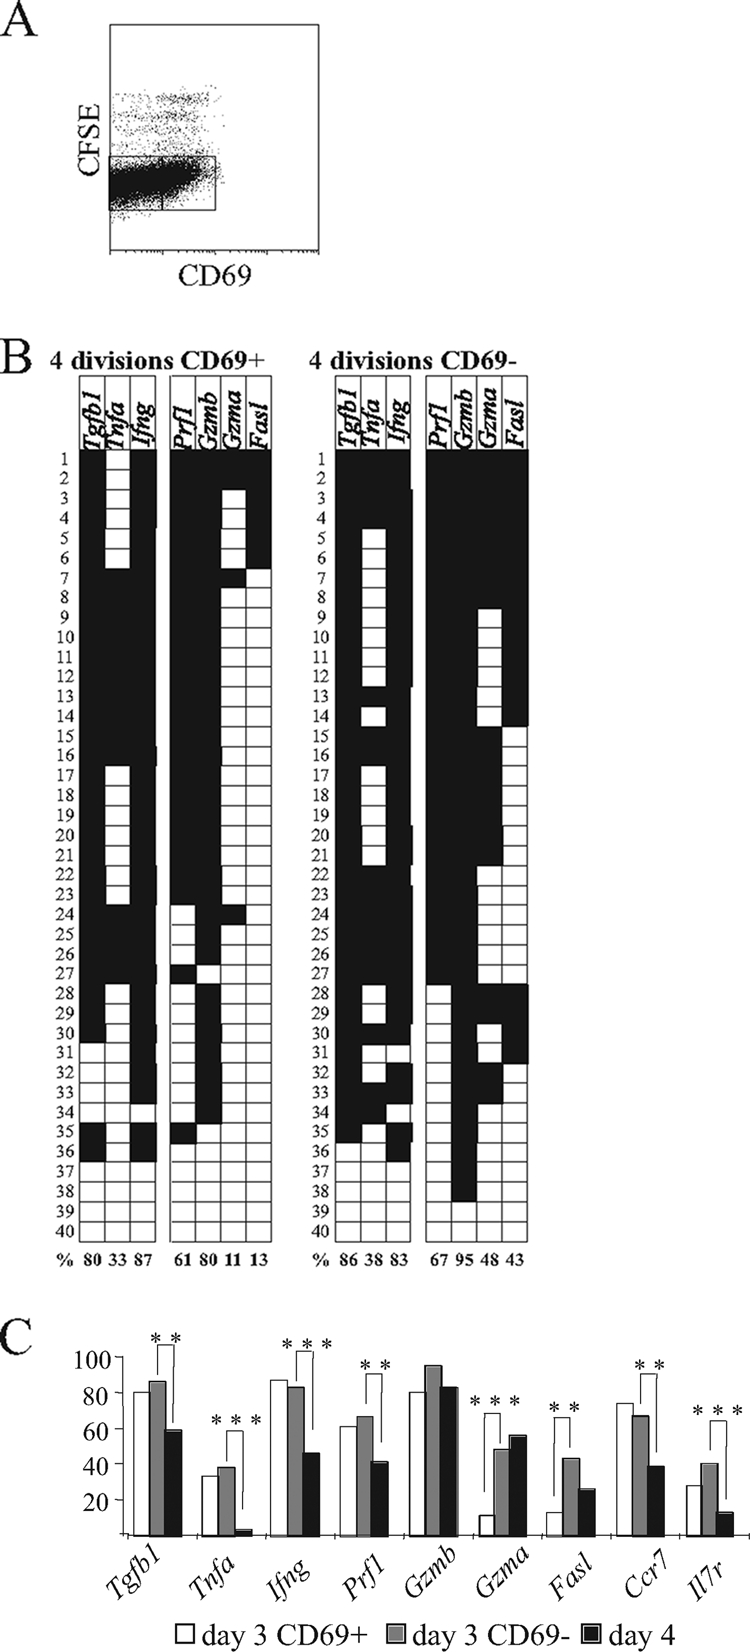
Rapid progress of CD8+ T-cell differentiation during early infection can be monitored using a combination of TCR Tg cells, CFSE division profiles, and CD69 expression. B6.Ly5.1 mice were injected with 5 × 10⁵ P14 Tg cells (Ly5.2+) and infected with 2 × 10⁵ PFU of LCMV Armstrong. (A) At day 3 postinfection, splenocytes were stained with CD69, and division profiles were analyzed by the evaluation of CFSE expression. Cells that had divided four or more times were sorted into two subpopulations (CD69+ and CD69−) based on the indicated gates. (B) Gene expression in individually sorted CD69+ and CD69− P14 cells was analyzed on day 3 postinfection; the results are presented in the same format as that used for Fig. 1B. (C) The progression of gene expression in individually sorted P14 cells was analyzed as the linear maturation of cells occurred (i.e., in the following sequence: day 3 CD69+ cells [white]→ day 3 CD69− cells [grey]→ day 4 [black]). Statistically significant differences between progressive differentiation stages are marked (** and ***, P < 0.01 and P < 0.001, respectively.