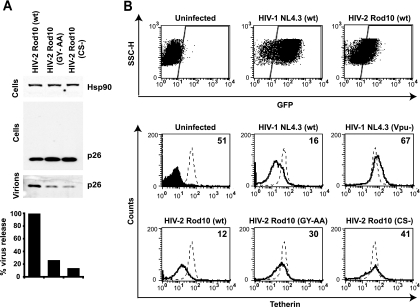
FIG. 9.
Antagonism and cell surface downregulation of tetherin by HIV-2 in CD4+ T-cell lines. (A) Jurkat cells were infected with the indicated HIV-2 Rod10 virus pseudotyped with VSV-G at an MOI of 0.2. Cell lysates and pellet virions were analyzed by Western blotting 48 h later, and virus release was quantified as the supernatant p26-CA band intensity, as a percentage of the wild-type control. (B) CEM-G37 cells were infected with the indicated VSV-G-pseudotyped viral stock at an MOI of 1. Forty-eight hours later cells were stained for surface tetherin expression and analyzed by flow cytometry. GFP+ infected cells were gated, and surface tetherin levels (solid lines) were compared to those of uninfected CEM-G37 cells (dotted lines). Numbers indicate median fluorescence intensities of surface tetherin on the infected cells. The solid peak in the upper left histogram represents the binding of the isotype control.

