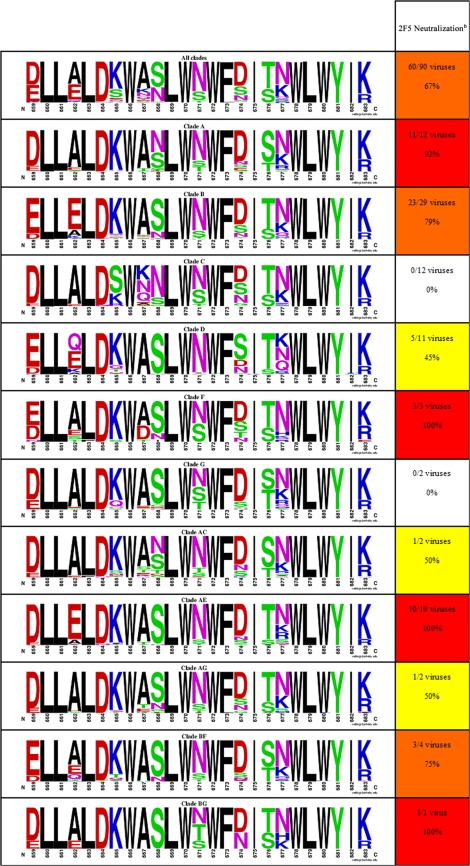
TABLE 2.
Natural sequence variation in HIV MPER and 2F5 neutralization across different cladesa
Footnotes for Table 2 on facing page.
The left column displays the overall sequence variability of HIV-1 Env residues 659 to 683 (gp41MPER) as well as sequence variability across different HIV-1 clades as a WebLogo representation (16, 60). Briefly, the height of each logo represents the relative frequency of a given residue at a particular position (see Materials and Methods for details). Single-letter representations of amino acids are color coded based on their chemical properties: basic, blue; acidic, red; polar residues G, S, T, Y, and C, green; polar residues N and Q, purple; and hydrophobic, black.
b The right column displays the ability of 2FS to neutralize HIV-1 viruses of different clades as previously reported by Binley et al. (6). To stay consistent with the original report, the data have been color coded according to the percentage of viruses that were neutralized: no viruses neutralized, white; 31 to 60% of viruses neutralized, yellow; 61 to 90% of viruses neutralized, orange; and >90% of viruses neutralized, red.

