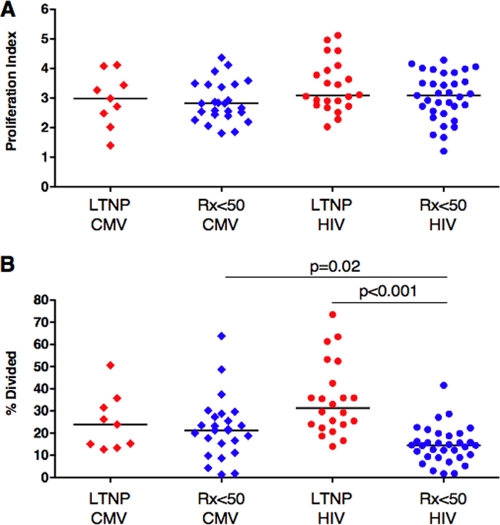
FIG. 2.
Proliferation analysis of virus-specific CD8+ T cells. (A and B) Summary of the proliferation index (A) and percent divided (B) for CMV (diamonds, n = 34 stainings) and HIV (circles, n = 55 stainings) tetramer-positive CD8+ T cells of LTNP (red symbols) and Rx <50 (blue symbols). Following stimulation for 6 days with either CMV pp65 peptides or HIV-infected autologous CD4+ T-cell targets, CD8+ T cells were stained with CMV or HIV tetramers, respectively, and analyzed with proliferation software to generate measures of the numbers of divisions that dividing cells had undergone (proliferation index) and the percentage of the original population of cells that had divided (percent divided). Horizontal lines represent median values. Comparisons were made using the Wilcoxon two-sample test. Only significant P values are shown.

