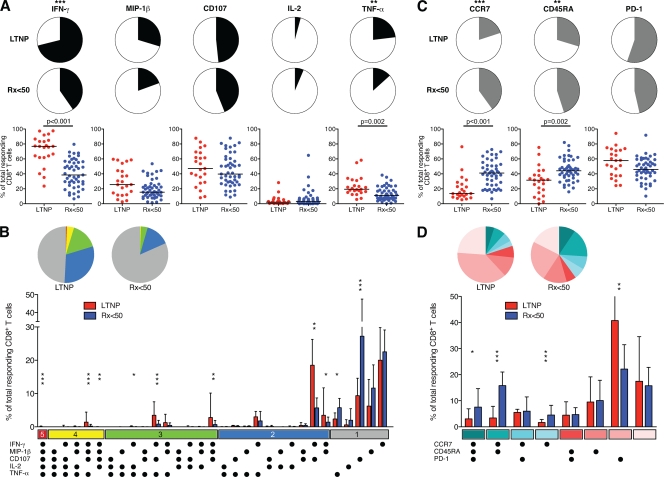
FIG. 4.
Polyfunctionality and phenotype of HIV-specific CD8+ T cells following stimulation with HIV-infected CD4+ T-cell targets for 6 h. (A) Summary pie charts show median percentages of total responding CD8+ T cells that express IFN-γ, MIP-1β, CD107, IL-2, or TNF-α in LTNP (n = 23, first row) and Rx <50 (n = 47, second row). Scatter plots (third row) depict the percent expression of each function for each LTNP and Rx <50. Horizontal lines represent median values. Comparisons were made using the Wilcoxon two-sample test. Only significant P values are shown. (B) Summary pie charts (top row) show median percentages of responding CD8+ T cells grouped according to the number of simultaneous functions executed: five functions, red; four, yellow; three, green; two, blue; and one, black. Individual functional subsets are shown in the summary bar graph (bottom row) for LTNP (red) and Rx <50 (blue). Background responses to uninfected targets have been subtracted. A line extends from the median to the upper interquartile range. Asterisks indicate significant differences between response pairs: ***, P < 0.001; **, P < 0.01; and *, P < 0.05. (C) Summary pie charts (first and second rows) and scatter plots (third row) show the fraction of the total responding CD8+ T cells expressing CCR7, CD45RA, or PD-1 for the same patients as in panel A. (D) Summary pie charts and bar graph show median percentages of responding CD8+ T cells expressing various combinations of the three phenotypic markers. CCR7+ subsets are shown in shades of teal, and CCR7− subsets are shown in shades of pink.

