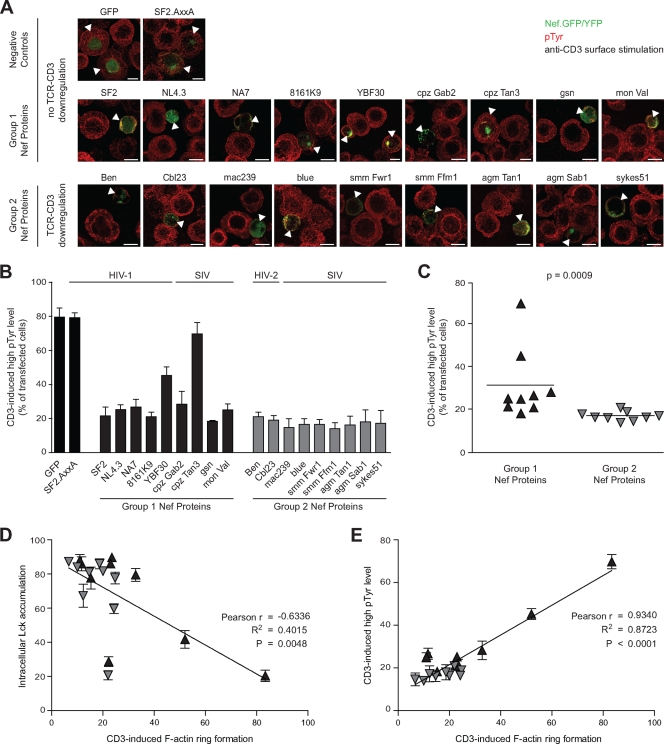
FIG. 4.
Correlation between Nef-mediated inhibition of TCR-induced actin dynamics and tyrosine phosphorylation. (A) Jurkat T cells transfected with the indicated expression plasmids were incubated on TCR-stimulatory surfaces, fixed, and analyzed for the subcellular distribution of pTyr-positive signaling complexes by confocal microscopy. Depicted are merged pictures of the GFP/YFP (green) and pTyr (red) channels 5 min after TCR stimulation. Arrowheads indicate transfected cells. Scale bar, 10 μm. (B) Quantification of the experiment shown in panel A. Values are the arithmetic means of at least three independent experiments plus the SD in which more than 100 cells were counted per condition. The pTyr levels of transfected cells were scored as high and low, respectively, by comparing the intensity of their pTyr staining to that of untransfected neighboring cells. (C) Comparison of pTyr levels in the presence of Nef proteins of groups 1 and 2. Bars indicate the mean values of the representative group, with the statistical significance indicated by the P value (Mann-Whitney U test). (D) Correlation analysis of the efficacy of Nef-mediated inhibition of F-actin rings with intracellular Lck accumulation (Pearson's r, R2). (E) Correlation analysis of the efficacy of Nef-mediated inhibition of F-actin rings with induction of high pTyr levels (Pearson's r, R2).

