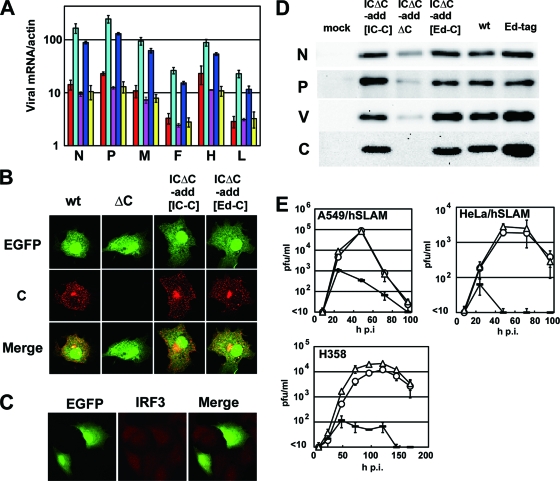
FIG. 3.
The C protein of the Edmonston tag strain is equivalent in functionality to the C protein of the IC-B strain. (A) Quantification of viral mRNAs. Vero/hSLAM cells were infected with recombinant MVs (red, wt; light blue, ICΔC; purple, ICΔC-add[IC-C]; blue, ICΔC-add[ΔC]; yellow, ICΔC-add[Ed-C]) at an MOI of 0.5. At 36 h p.i., the viral mRNA levels in the cells were analyzed by reverse transcription-quantitative PCR as previously described (23). Data represent the means ± SD of results from triplicate samples. (B) Intracellular distribution of the C protein. Vero/hSLAM cells were infected with recombinant MVs expressing EGFP (18) at an MOI of 0.5 in the presence of a fusion-blocking peptide (32). At 36 h p.i., the intracellular distribution of the C protein was analyzed by an indirect immunofluorescence assay using appropriate primary and secondary antibodies (23). Green and red fluorescence indicate EGFP encoded in the recombinant MV genome and the C protein, respectively. (C) Indirect immunofluorescence assay for IRF3. ICΔC-add[Ed-C]-infected A549/hSLAM cells were subjected to an indirect immunofluorescence assay for IRF3 using the same procedures described in the legend for Fig. 2C. (D) Expression of viral proteins. Viral proteins in recombinant MV-infected A549/hSLAM cells were detected using the same procedures described in the legend for Fig. 2D. (E) Growth kinetics. Monolayers of A549/hSLAM, HeLa/hSLAM, and H358 cells were infected with recombinant MVs (○, ICΔC-add[IC-C];  , ICΔC-add[ΔC]; ▵, ICΔC-add[Ed-C]) at an MOI of 0.01. At various time intervals, the infectious virus titers were determined by plaque assays. Data represent the means ± SD of results from triplicate samples.

