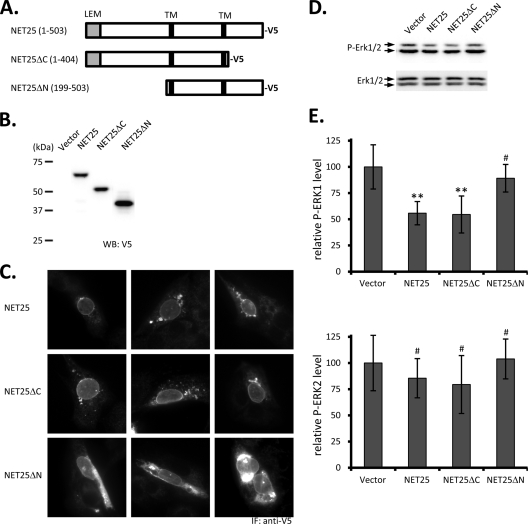
FIG. 6.
ERK activation in C2C12 cells after overexpression of NET25, NET25ΔC, and NET25ΔN. (A) Schematic of the full-length and truncated NET25 proteins used in these experiments. Numbers in parentheses indicate amino acid regions of human NET25 expressed in the resulting recombinant protein. The C-terminal V5 tag is indicated. (B) Western blot analysis of expression of full-length and truncated NET25 in C2C12 cells. Samples were probed with anti-V5 antibody to detect the tagged fusion proteins. (C) Immunofluorescence (IF) microscopy analysis of V5-tagged NET25, NET25ΔC, and NET25ΔN localization. Three representative images are shown for each construct. (D) Example of a semiquantitative Western blot analyzing ERK activation after treating NET25-, NET25ΔC-, or NET25ΔN-expressing C2C12 cells with 0.3 mg/ml rEGF for 15 min. (E) Graphs summarizing quantification of ERK1 (top) and ERK2 activation (bottom) from at least four experiments. Error bars indicate standard deviations. Asterisks mark statistically significant differences in comparison to the vector control (P ≤ 0.006). The # symbol indicates P values of ≥0.354.

