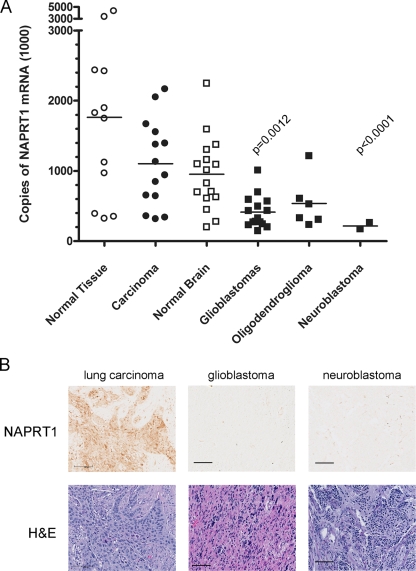
FIG. 9.
NAPRT1 mRNA and protein expression in primary human tumor tissues. (A) Comparison of NAPRT1 mRNA levels in normal tissue to levels in malignant tissue of the same origin. Levels of NAPRT1 mRNA from normal, carcinoma, brain, normal brain, glioblastoma, oligodendroglioma, and neuroblastoma frozen tissue samples were measured by qRT-PCR. Values were normalized to ribosomal protein-large P0 mRNA levels; solid bars indicate the means. Statistical significance was determined by Student's t test with Welch's correction; P values are indicated. (B) Immunohistochemical detection of NAPRT1 protein in lung, glioblastoma, and neuroblastoma tumor tissue sections. Upper panel, sections (5 μm) were stained with a rabbit polyclonal NAPRT1 antibody. Lower panel, sequential sections were stained with hematoxylin and eosin (H&E) to reveal cellular structures. Scale bars, 100 μm.

