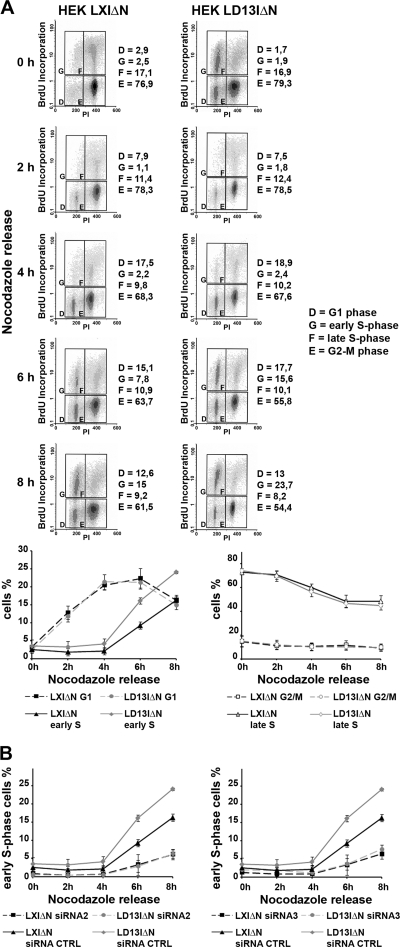
FIG. 6.
HOXD13 promotes DNA synthesis initiation in HEK293 cells. (A) HEK293 cells transduced with LD13IΔN or the control LXIΔN were arrested in G2/M phase by nocodazole treatment, released for the indicated times, pulse-labeled with BrdU, and analyzed by flow cytometry after propidium iodide staining. Gated cell populations represent G1-phase cells (D), early S-phase cells (G), late S-phase cells (F), and G2/M-phase cells (E). The progression of the cells in the different cell cycle phases is plotted in the charts at the bottom. Progressions through the G1 and early S phases are shown on the left; late S and G2/M progressions are shown on the right. Error bars represent the means ± the SEM of three independent experiments. (B) HEK-LD13IΔN and HEKLXIΔN cells were nocodazole arrested in G2/M phase after transfection with D13-siRNA2 (left graph), D13-siRNA3 (right graph), or with the control siRNA (siRNA CTRL). Cells were released from G2/M block for the indicated times, pulsed with BrdU, and analyzed by flow cytometry after propidium iodide staining. Graphs show changes in the proportion of cells in early S-phase over time.

