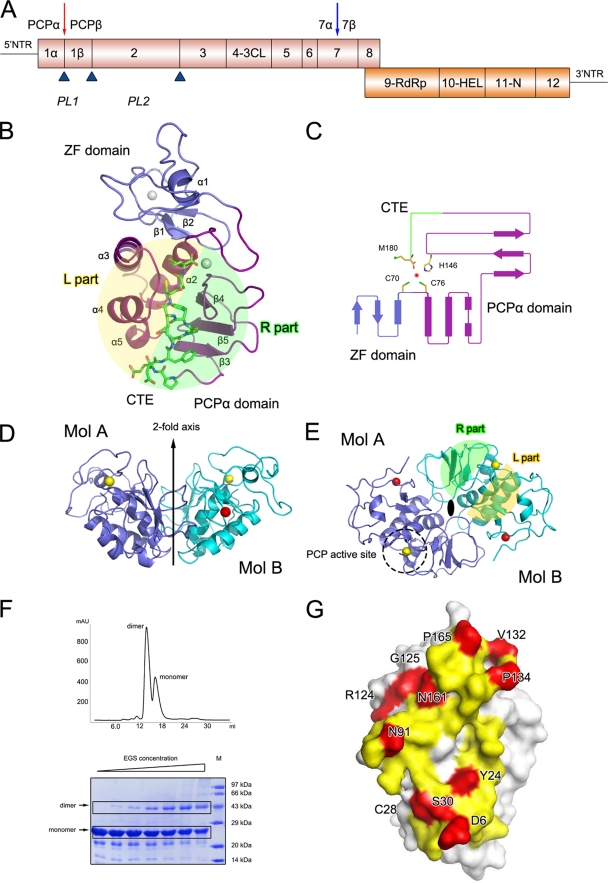
FIG. 1.
Crystal structure of PRRSV nsp1α. (A) Diagrammatic representation of the PRRSV genome. ORF1a and ORF1b are shown as magenta and orange bars. Putative nsp's are labeled. The predicted or reported PCPα, PCPβ, and PCP2 cleavage sites are represented as upward-pointing blue triangles. The Nsp1α cleavage site is highlighted by a red downward arrow, and the potential subdivision of PRRSV nsp7 suggested by the study of EAV nsp7 (34) is marked by a blue downward arrow. The named or putative signature motifs of nsp's are labeled at their positions in the PRRSV genome, including PCP (PL1), cysteine protease (PL2), serine/3C protease (3CL), polymerase (RdRp), helicase (Hel), and Xenopus laevis homolog poly(U)-specific endoribonuclease (N). (B) The monomer fold. The N-terminal ZF domain, C-terminal PCPα domain, and CTE are represented as slate and purple ribbons, and green sticks, respectively. (C) Topology diagram. The color scheme is the same as that used in panel A. The α-helices and β strands are shown as bars and arrows, respectively. The residues that correspond to PCPα activity are shown as sticks. (D and E) Side and top views of the nsp1α homodimer. The two monomers are colored in slate and cyan, respectively. The zinc atoms in the ZF domains and PCP domains are shown as red and golden spheres, respectively. The twofold axis, PCP active site, and L/R parts are marked or highlighted. (F) Gel filtration and cross-linking results for nsp1α. In the gel filtration of nsp1α (top), 0.5-ml nsp1α solution at a concentration of 2 mg/ml was loaded on a Superdex 200 column (GE Healthcare) and eluted with a buffer containing 50 mM MES (pH 6.0), 1 M NaCl, and 50 mM DTT. The EGS cross-linking result is also shown (bottom). The EGS concentration was used at 0 mM, 0.315 mM, 0.625 mM, 1.25 mM, 2.5 mM, 5.0 mM, and 10.0 mM, shown from left to right. Recombinant nsp1α was diluted to 5 mg/ml in phosphate buffered saline (pH 7.0), 1 M NaCl, and 1 mM DTT. The sizes of the molecular mass markers (in thousands) are indicated on the right. (G) Dimer interface of an nsp1α subunit. Residues that contribute to the dimer interaction are colored yellow for parts that are buried (solvent inaccessible) and red for parts that are involved in close contacts (<3.6 Å).

