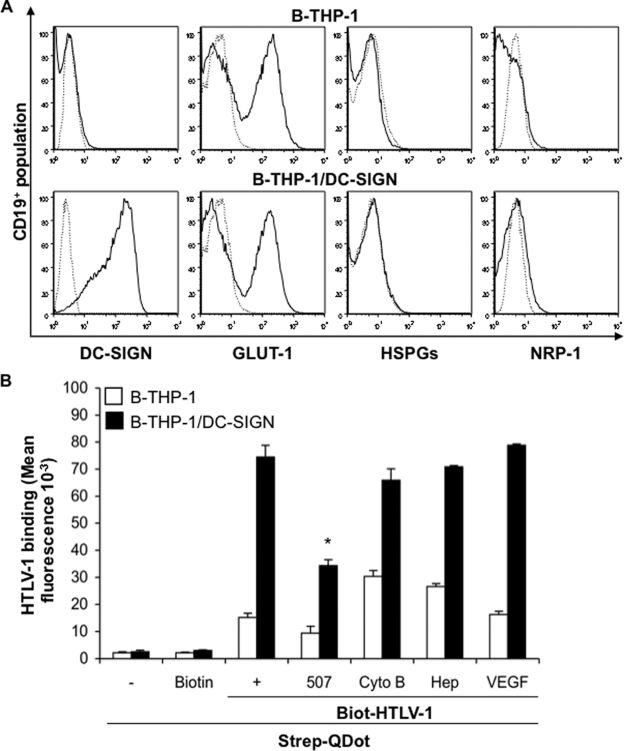
FIG. 1.
Analysis of HTLV-1 binding to B-THP-1 cells. (A) Parental B-THP-1 cells or cells transduced to stably express DC-SIGN (B-THP-1/DC-SIGN) were incubated with an FITC-labeled anti-CD19 Ab in combination with APC-labeled anti-DC-SIGN, Alexa Fluor 647-labeled anti-GLUT-1, or anti-HSPGs, and PE-labeled anti-NRP-1 Abs and were analyzed by flow cytometry. A total of 50,000 events collected for each sample were gated to include the CD19+ population. Isotype controls are represented by dotted-line histograms, whereas solid-line histograms represent Ab reactivity with respect to the indicated receptor molecules. (B) A QDot-based binding assay was employed to determine the effect of blocking DC-SIGN and other receptor molecules on HTLV-1 binding to B-THP-1 cells. Target cells (1 × 10⁶) either were left untreated or were treated (30 min, room temperature) with a blocking Ab against DC-SIGN (clone 507; 20 μg/ml), the GLUT-1 inhibitor Cyto B (20 μM), the HSPG inhibitor Hep (20 mU), or NRP-1 ligand (VEGF; 50 ng/ml). Cells subsequently were incubated with Biot-HTLV-1 (125 ng/106 cells) for 45 min on ice, and the binding was quantified as described in Materials and Methods. Cells incubated with QDots or biotin alone were used as negative controls. HTLV-1 binding was estimated as the fluorescence measured at 400 or 605 nm. The results shown represent the mean fluorescence ± standard deviations (T bars) from three independent experiments each performed in duplicate. An asterisk denotes a statistically significant decrease in fluorescence compared to maximum binding without any inhibitor (P ≤ 0.05).

