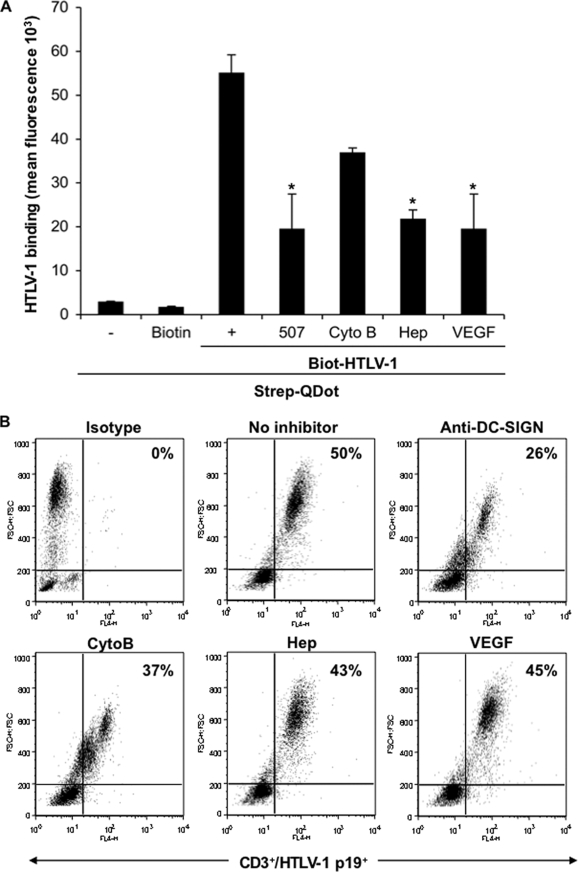
FIG. 6.
Transmission of HTLV-1 from DCs to T cells. The flow-cytometric observations shown in Fig. 4B were further confirmed by a QDot-based binding assay as described in Materials and Methods. (A) MDDCs were pretreated with the specific inhibitors of the receptor and subsequently were incubated with biotin-HTLV-1 (125 ng/106 cells) for 45 min on ice, washed three times, and incubated with Strep-QDot for 30 min. After being washed, cells were fixed and analyzed for HTLV-1 binding as determined by fluorescence measured at 400 or 605 nm. Cells exposed to QDot or biotin alone were used as negative controls. The results shown represent mean fluorescence ± standard deviations from three independent experiments, each performed in duplicate. The asterisk denotes a statistically significant decrease in fluorescence compared to that of maximum binding without any inhibitor (P ≤ 0.05). (B) To examine the role of the cellular receptor molecules in the cell-free transmission of HTLV-1 from DCs to T cells, immature DCs were pretreated with inhibitors as described for panel A and incubated with HTLV-1 (3 μg/106 cells) for 2 h at 37°C, washed, and mixed with equal numbers of autologous T cells. Following 6 days of coculture, cells were incubated with PE-Cy5-labeled anti-CD3 Ab, fixed, permeabilized, and incubated with the Alexa Fluor 647-labeled anti-p19 Ab. A total of 50,000 events collected for each sample were gated to include live CD3+/HLTV-1 p19+ T cells. The numbers shown indicate the percentage of cells positive for both CD3 and HLTV-1 p19+. The results are representative of one of the three independent experiments.

