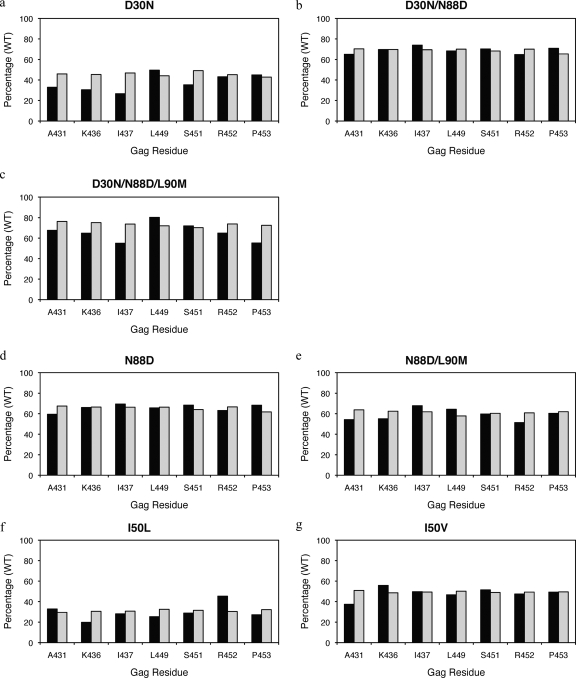
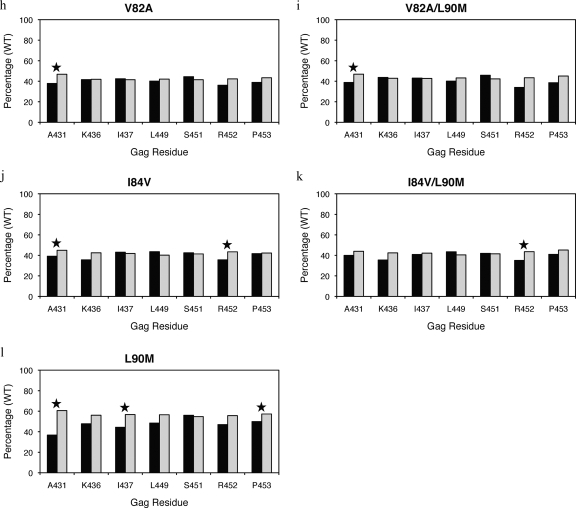
FIG. 4.
RCs of viruses with primary drug-resistant protease mutations (a to l) and associated NC-p1 and p1-p6 cleavage site mutations. RCs of viruses tested are shown as a percentage of the WT reference virus (100%) on the y axis, and on the x axis are Gag residues within NC-p1 and p1-p6 that mutate frequently. Closed bars represent viruses with both the particular protease and cleavage site mutations present. Open bars represent viruses with only the particular protease mutations present. Stars indicate a significant difference in RCs for a particular set. P values of ≤0.05 are significant.


